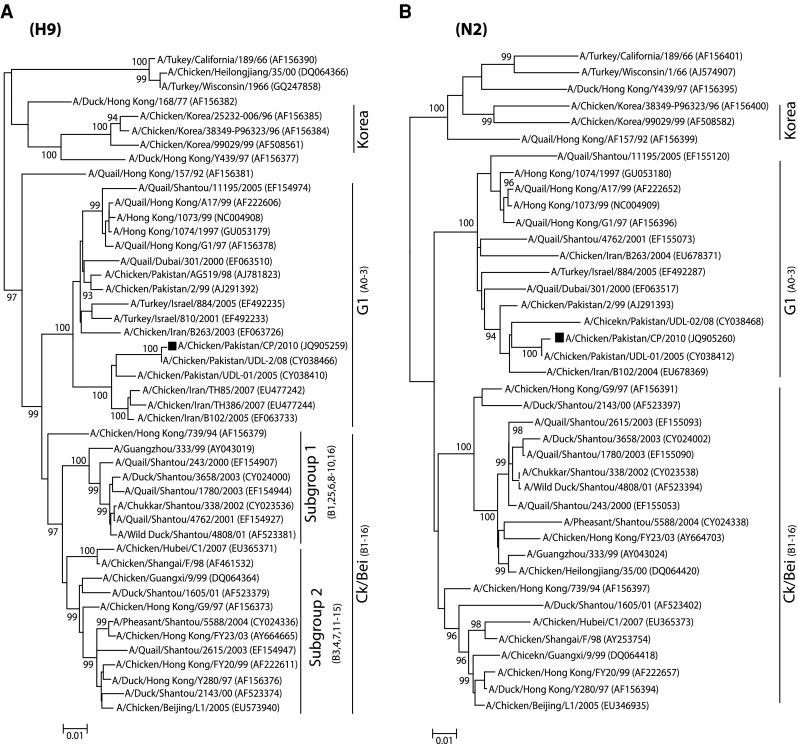
Fig. 1.

Phylogenetic analysis of HA and NA genes of representative influenza A viruses isolated in Asia. Trees (unrooted) were generated by the neighbor-joining method with the MEGA programme (Bayesian analysis revealed similar relationships). Numbers above the branches indicate neighbor-joining bootstrap values. Only bootstrap values above 80 % are shown. The analysis was based on nucleotides 129–1,042 of the HA gene, and 231–1,297 of the NA gene. The isolate characterized in this study is labeled with a black square. A bar represents 0.01 substitutions per site whereas codes in the trees represents the cross-immunity based genotypes
