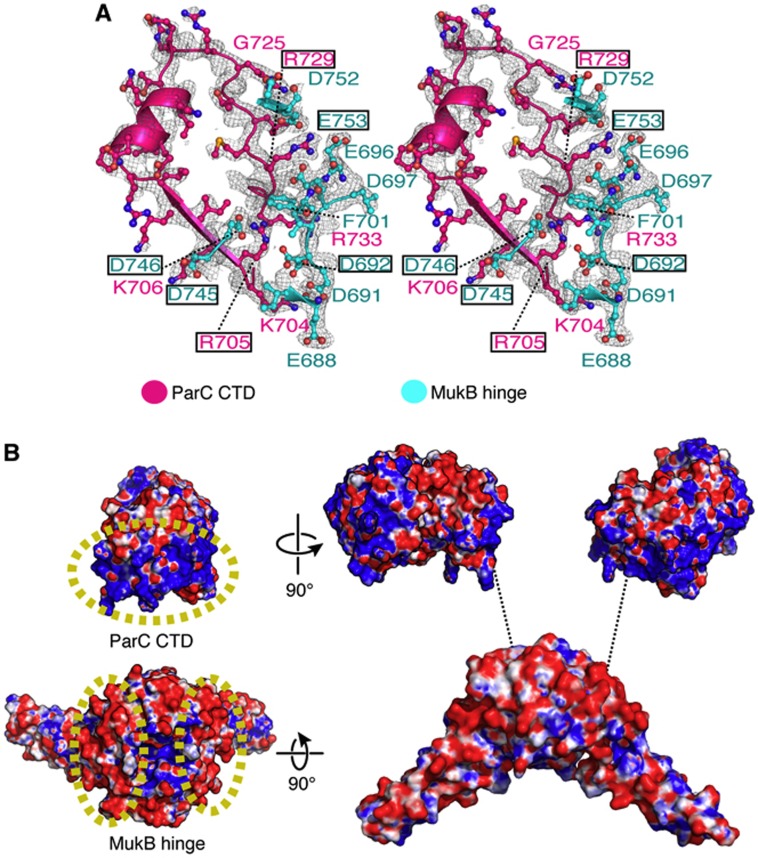
Figure 2.
The hinge·CTD interaction is predominantly electrostatic. (A) Stereo representation of MukB hinge (cyan)·ParC CTD (pink) interface shown with a 2Fo−Fc map contoured at 1σ. Interacting residues are labelled; boxed residues were mutated and assayed in this study. (B) Electrostatic potential map of the MukB·ParC interaction surfaces. On the left, a single ParC CTD and MukB hinge dimer are coloured according to surface charge (blue for positive and red for negative). The interacting surfaces of MukB and ParC are demarcated by yellow, dashed ovals. On the right, an exploded view of the hinge-CTD complex is shown.

