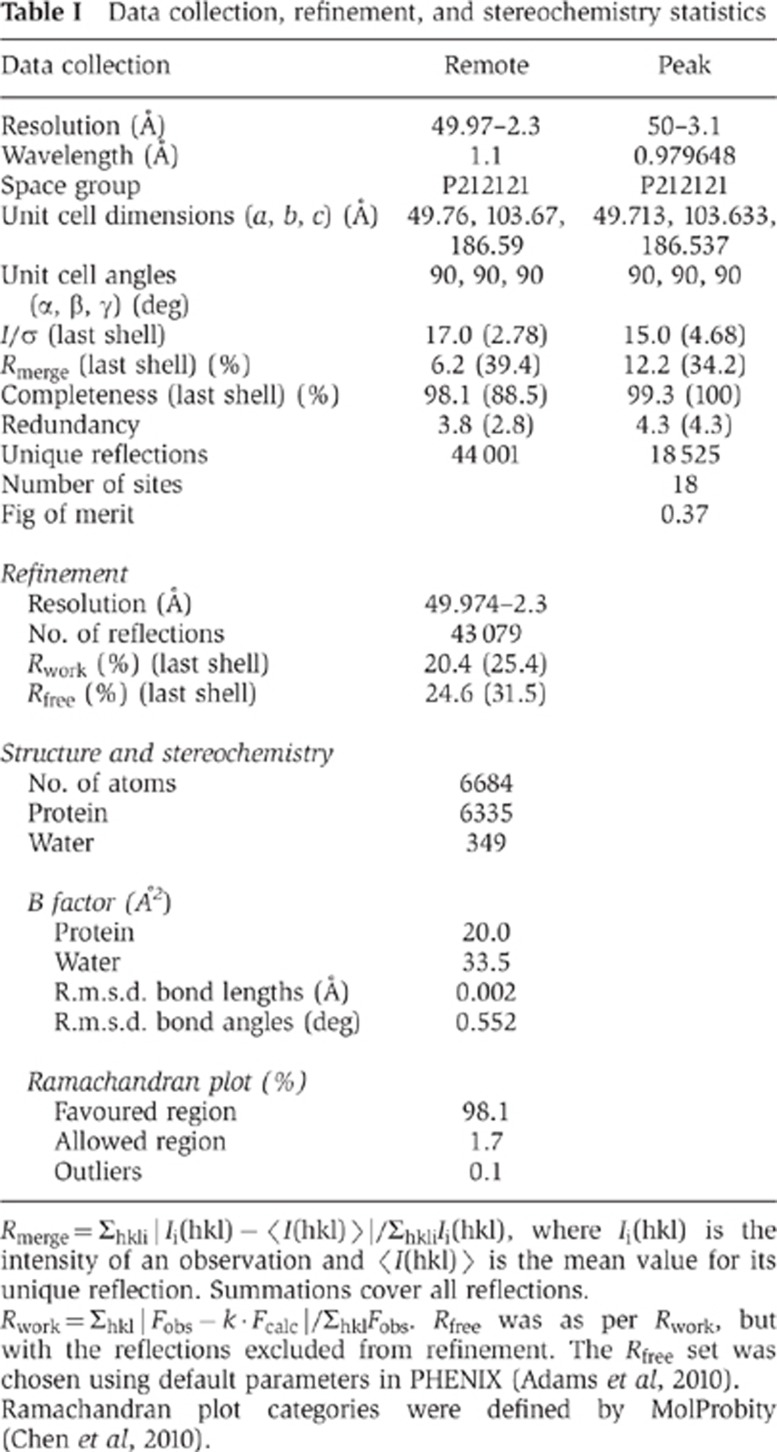
Table 1. Data collection, refinement, and stereochemistry statistics.
Rmerge=Σhkl|Ii(hkl)−〈I(hkl)〉|/ΣhklIi(hkl), where Ii(hkl) is the intensity of an observation and 〈I(hkl)〉 the mean value for its unique reflection. Summations cover all reflections.
Rwork=Σhkl|Fobs−k·Fcalc|/ΣhklFobs. Rfree was as per Rwork, but with the reflections excluded from refinement. The Rfree set was chosen using default parameters in PHENIX (Adams et al, 2010).
Ramachandran plot categories were defined by MolProbity (Chen et al, 2010).

