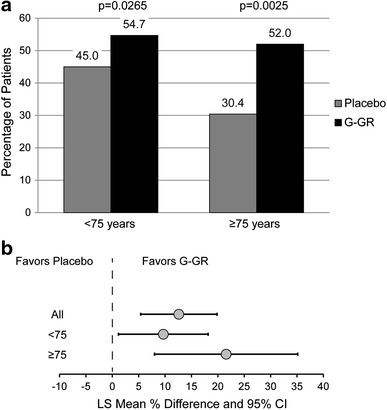
Fig. 2.

Proportion of patients with at least 30 % reduction in LOCF ADP score at week 10. a Percentage of patients. p-Value is the test for treatment effect between the two G-GR age groups and their respective placebo based on the z test for the difference in proportions between two groups. b Forest plot for LS mean difference in ADP responders. ADP average daily pain, G-GR gastroretentive gabapentin, LOCF last observation carried forward, LS least square
