
Fig. 3.
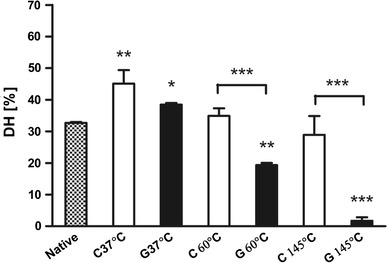
The degree of hydrolysis of Ara h 1 treated without glucose—control (C) and with glucose (G). Two independent experiments for two different batches of treated Ara h 1 were performed in triplicate. Data were expressed as mean ± SD. *p < 0.05 compared to native Ara h 1 (lower part); statistical differences between Ara h 1 treated in the presence and absence of glucose (upper part)