Fig. 5.
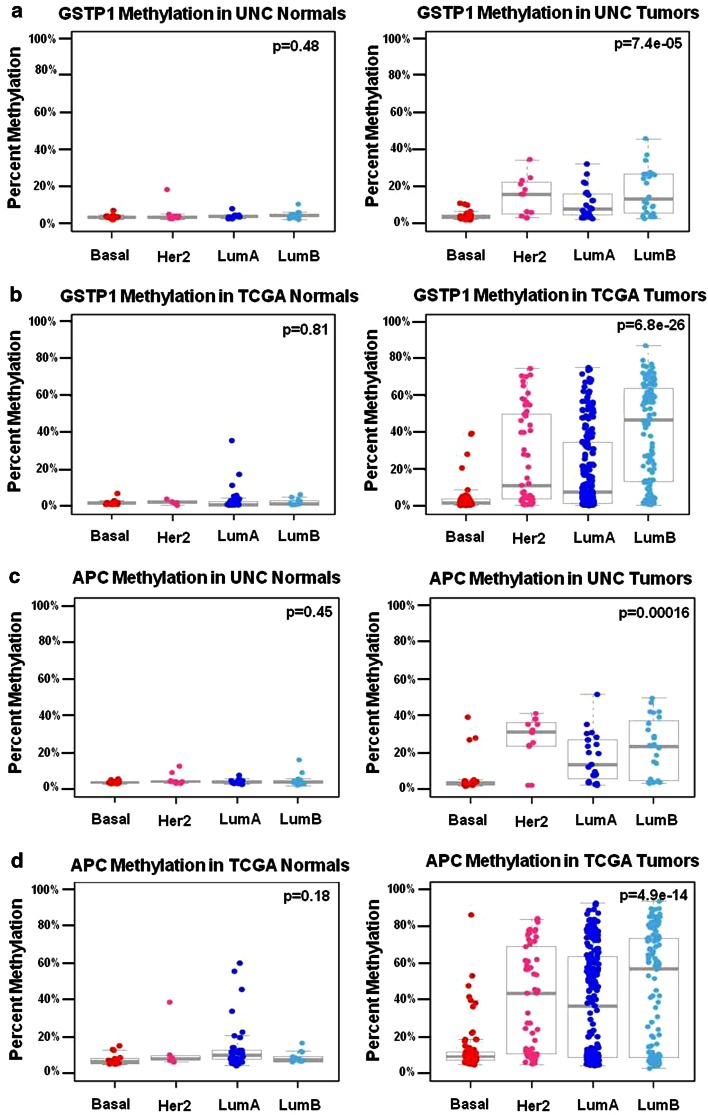
a–d MP4 gene loci display a hypomethylated phenotype in basal tumors and differential methylation in non-basal HER2, LumA, and LumB tumors. Box plots show percent methylation distributions in normal breast tissue and matched breast tumors. MP4, subtype-dependent, differentially methylated in non-basal tumors “SD-DMinNB” patterns were validated in the TCGA tumor and matched normal sample set. A significant difference by ANOVA was observed in average percent methylation of GSTP1 between molecular subtypes in both a the UNC tumor dataset and b the TCGA tumor dataset for the matched GSTP1 cg04920951 probe, while no significant difference was observed in matched normal tissue in either dataset. APC also demonstrated an MP4 methylation locus pattern, but unlike GSTP1, APC methylation was not associated with gene expression in either the c UNC or d TCGA dataset. (Boxplots shown are of averaged percent methylation across the MassARRAY amplicon in the UNC samples, and averaged β values for three matched APC probes; cg21634602, cg20311501, and cg16970232, respectively). ANOVA p values for testing methylation differences between molecular subtype are provided in the top right of each box plot

