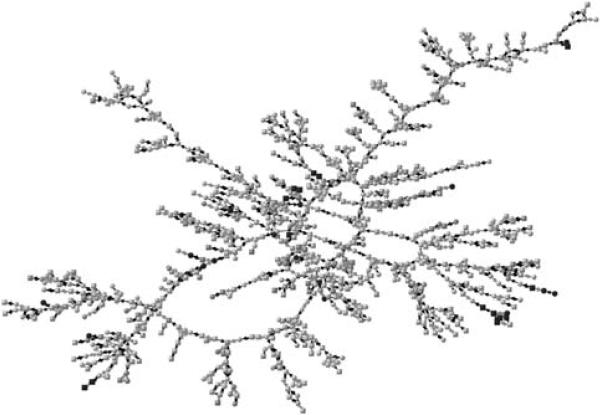
Figure 1.
Depression Clusters in the Framingham Social Network. This graph shows the largest component of friends, spouses and siblings at exam 7 (centered on the year 2000). There are 957 individuals shown. Each node represents a subject and its shape denotes gender (circles are male, squares are female). Lines between nodes indicate relationship (red for siblings, black for friends and spouses). Node color denotes the percentile score of the mean level of depression in ego and all directly connected (distance 1) alters, with yellow being below the 80th percentile, shades of green being the 80th to 95th percentile, and blue being above the 95th percentile (the most depressed).

