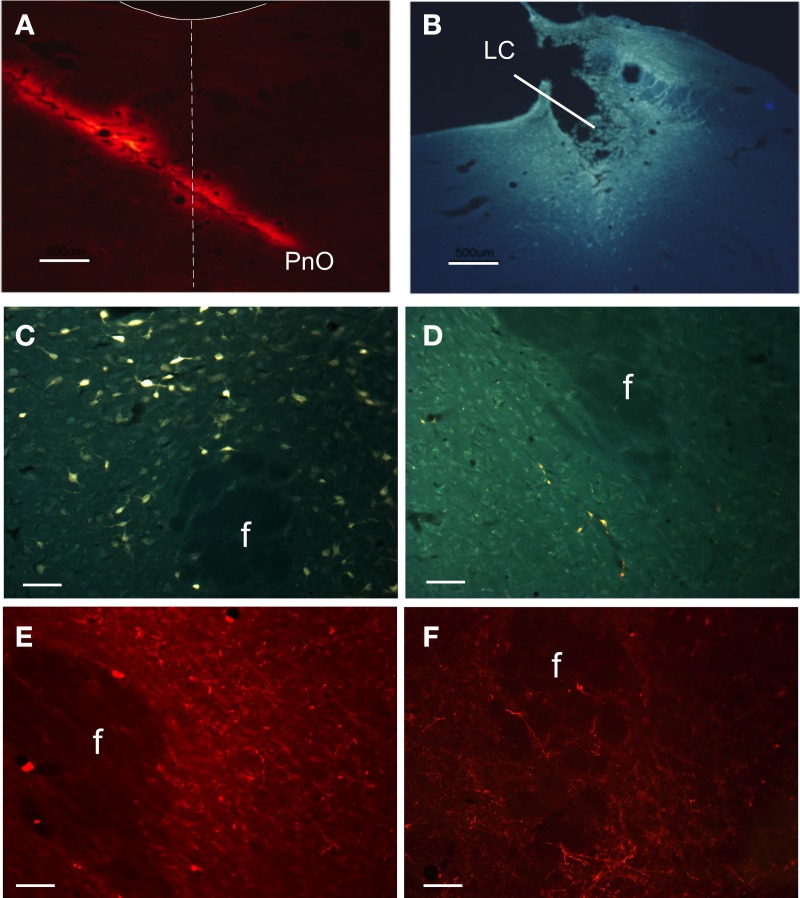
Figure 1.
Anatomical projections between PeFLH area and LC or PnO nuclei. (A) Microphotograph showing a representative case of FR injection aimed at PnO from the contralateral side. Dash line indicates midline; solid line indicates the IV ventricle contour. (B) Microphotograph of a FG injection aimed at LC. (C,D) Microphotographs showing labeled neurons in the PeF area after FG injection in PnO nucleus (C) and LC nucleus (D). (E,F) Microphotographs of two cases showing fiber terminals after FR injections in PnO nucleus (E) and LC nucleus (F). f: fornix. Calibration bars in (A) and (B), 500 μm. Calibration bars in (C–F), 150 μm.

