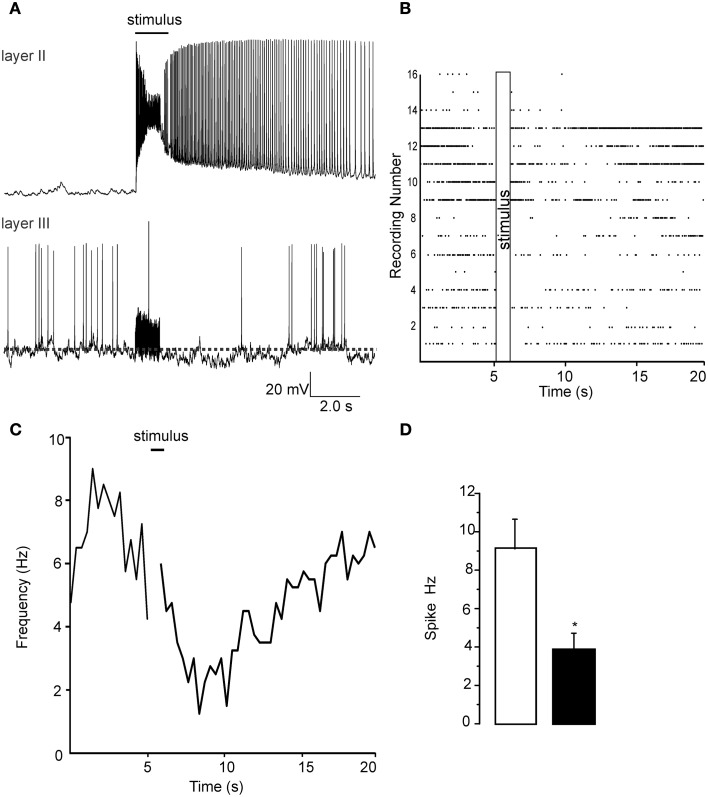
Figure 2.
Patch clamp recordings from Layer II and layer III cells show opposite changes in excitability due to a 1 s long 60 Hz stimulus. (A) Top trace shows the increase in activity that occurs in layer II pyramidal cells when the LOT is stimulated. Each stimulus pulse causes an EPSP that supports an action potential (not shown). At the end of the stimulus train action potential generation continues for up to 10 s after the stimulus. Lower trace in (A) shows a recording from a layer III cell where a reduction in action potential frequency was evident. Note that the stimulus is unable to trigger any kind of response during the train but a small slowly developing hyperpolarization was evident in most recordings. (B) A raster plot of the 16 recordings analyzed in these experiments is shows that although there was a wide variability in the initial spike frequency there was a uniform reduction in frequency immediately proceeding the stimulus train. In (C) we show the time course of the reduction spike frequency over a 14 s period after the stimulus of LOT. (D) Control recordings had a spontaneous frequency of about 8–10 Hz after the stimulus this was reduced to about 4 Hz after the pulse train. *p < 0.01.

