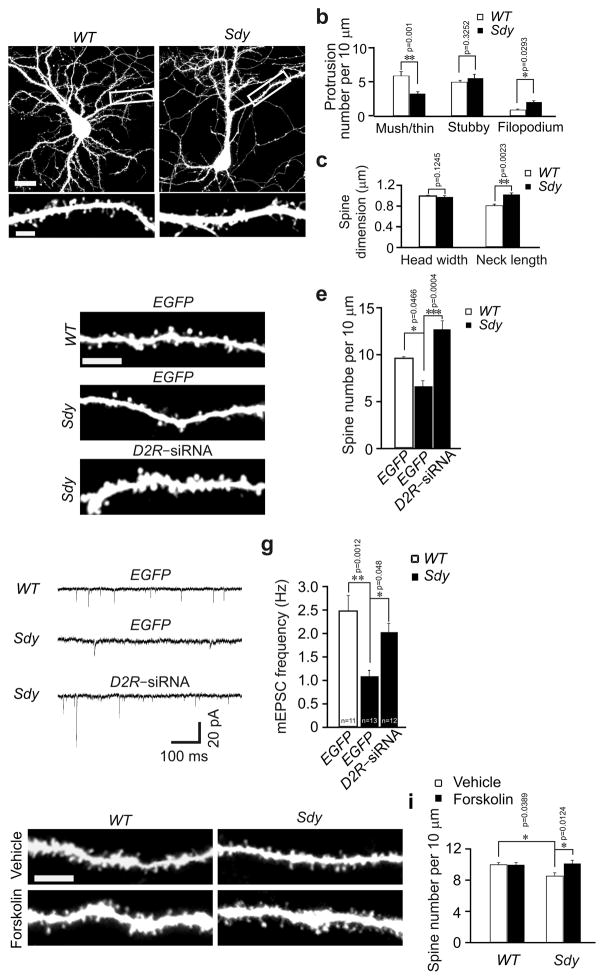
Fig. 5.
Spine deficiency in sandy mice is caused by D2R hyperactivity. (a–c) Primary hippocampal neurons were prepared from wild–type and sandy mice, transfected with the Venus construct at DIV14, and imaged at DIV17. Representative images of transfected neurons and dendrites at a higher magnification are shown in (a), and quantification is shown in (b, c); the results were replicated by three independent experiments, and one of the three replicates (n = 15 for each condition) is shown in the histograms. (d–i) At 3 weeks of age, sandy mice and their wild–type littermates were injected with lentivirus expressing EGFP or D2R siRNA, or intraperitoneally injected with vehicle or forskolin (4 mg/kg), then used for preparation of hippocampal slices for spine analysis (d, e), mEPSC analysis (f, g) or diolistic labeling (h, i). (d, h) Representative images of basal dendrites from CA1 neurons. (e) Quantification of spine density for (d); 15 neurons from 3 slices of each animal and 3 mice for each condition were imaged and analyzed. (i) Quantification of spine density for (h); 15 neurons from 3 slices of each animal and 3 mice for each condition were imaged and analyzed. (f) Sample trace of mEPSCs. (g) Quantificaiton for (f); 5–8 slices of 3–5 animals for each condition; n= the total number of recorded neurons. Scale bar, 20 μm for images of neurons and 5 μm for images of dendrites. Data are presented as mean ± SEM. Mann–Whitney test was used for statistical analysis.

