
Figure 1. Discovery phase results.
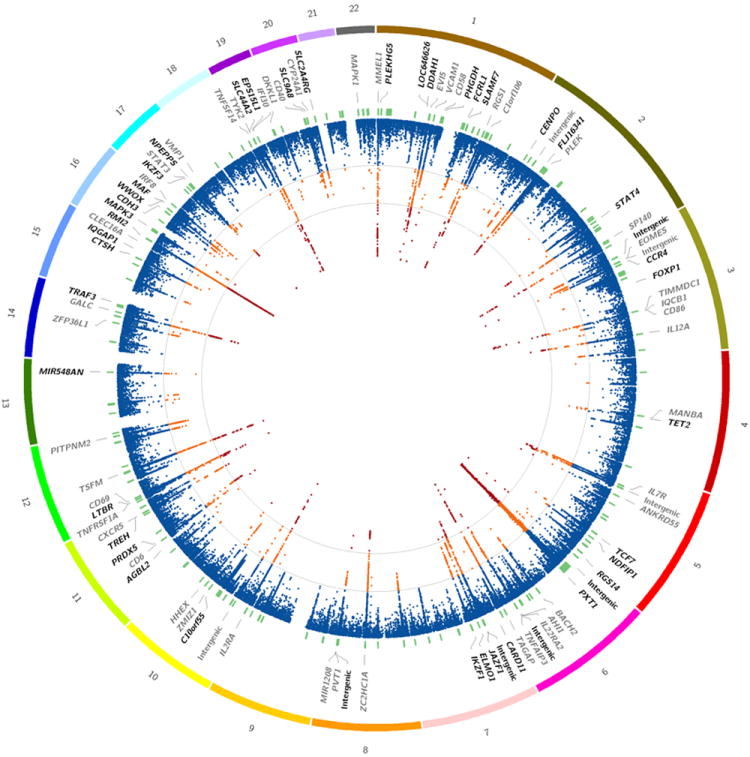
Primary association analysis of 161,311 autosomal variants in the discovery phase (based on 14,498 cases and 24,091 healthy controls). The outer most track shows the numbered autosomal chromosomes. The second track indicates the gene closest to the most associated SNP meeting all replication criteria. Previously identified associations are indicated in grey. The third track indicates the physical position of the 184 fine-mapping intervals (green). The inner most track indicates −log(p) (two-sided) for each SNP (scaled from 0-12 which truncates the signal in several regions, see Supplementary Table 1). Additionally, contour lines are given at the a priori discovery(−log(p) = 4) and genome-wide significance (-log(p) = 7.3) thresholds. Orange indicates -log(p) ≥ 4 and < 7.3, while red indicates −log(p) ≥ 7.3. Details of the full discovery phase results can be found in ImmunoBase.