
Figure 2. Bayesian fine-mapping within primary regions of association.
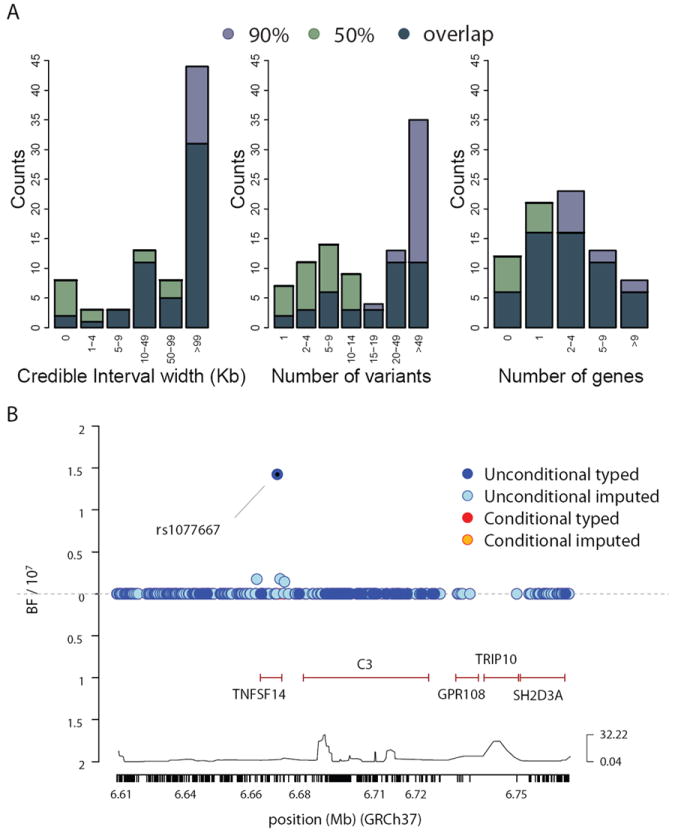
a) Summary of the extent of fine-mapping across 66 regions in 9,617 healthy controls from the UK, showing the the physical extent of, the number of variants, and the number of genes spanned by the posterior 90% and 50% credible sets. b) Detail of fine-mapping in region of TNFSF14. Above the x-axis indicates the Bayes Factor summarizing evidence for association for the SNPs prior to conditioning (blue markers) while below the x-axis indicates the Bayes Factor after conditioning on the lead SNP (rs1077667). Mb=Megabases.