
Figure 6.
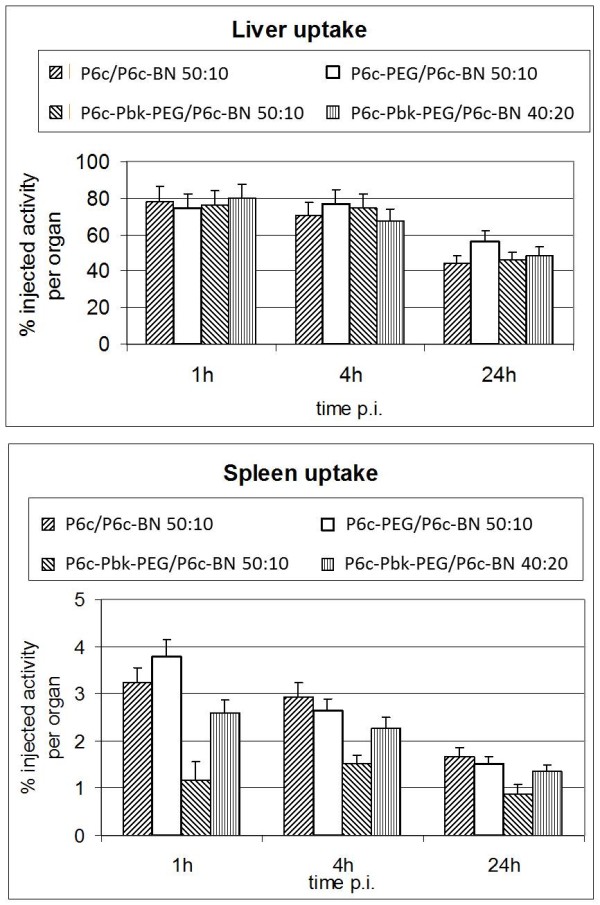
Uptake in the liver (top) and spleen (bottom) expressed as % of the injected activity per whole organ at different times after injection.
Official websites use .gov
A
.gov website belongs to an official
government organization in the United States.
Secure .gov websites use HTTPS
A lock (
) or https:// means you've safely
connected to the .gov website. Share sensitive
information only on official, secure websites.
Uptake in the liver (top) and spleen (bottom) expressed as % of the injected activity per whole organ at different times after injection.