Figure 2.
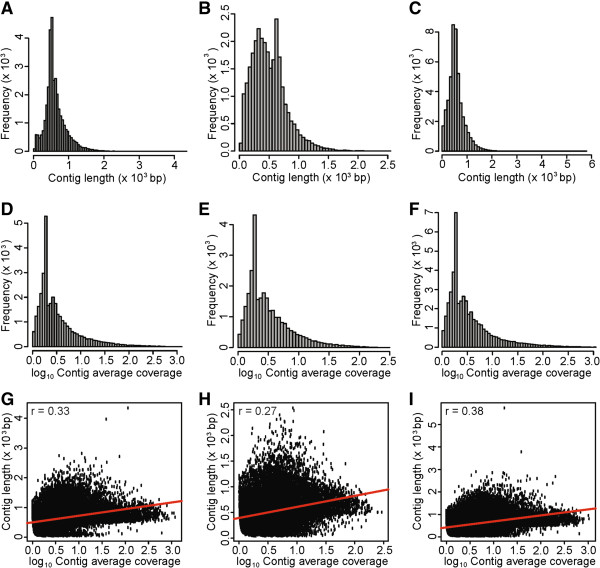
Size distribution and characteristics of assembled contigs. Frequency distribution of contigs assembled from the pool of publicly available T. salsuginea ESTs and 454 reads derived from (A) non-normalized library, (B) normalized library or (C) combined libraries. Frequency distribution of contig average coverage for the assembly of publicly available T. salsuginea ESTs pooled with 454 reads derived from (D) non-normalized library, (E) normalized library or (F) combined libraries. Pearson’s correlations between contig length and contig average coverage for the assembly of publicly available T. salsuginea ESTs pooled with 454 reads derived from (G) non-normalized library, (H) normalized library or (I) combined libraries.

