Figure 2.
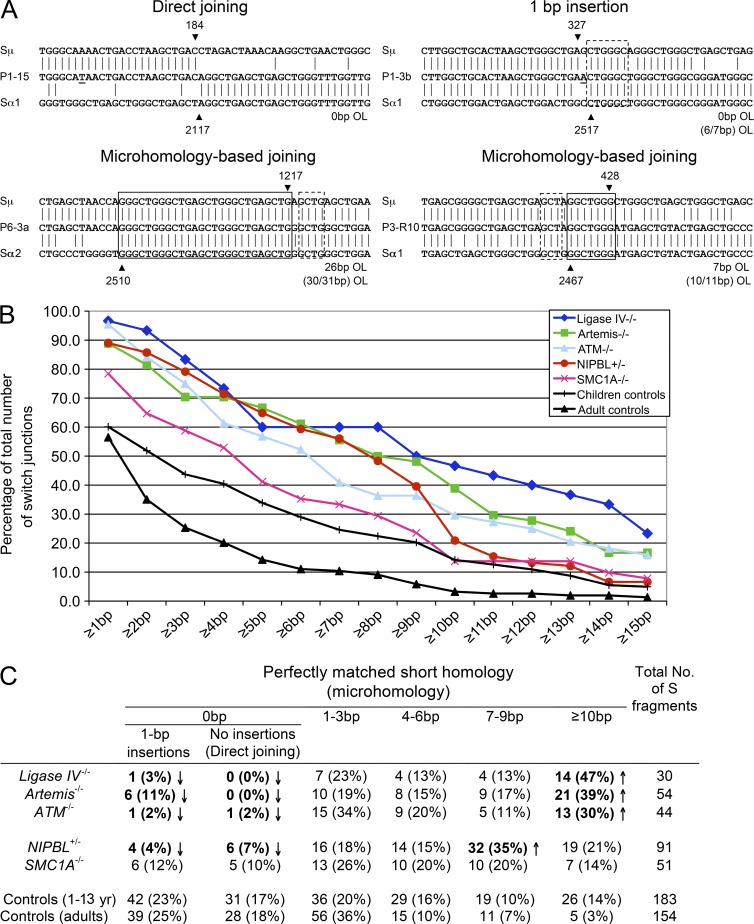
Increased usage of microhomologies at Sμ–Sα junctions in NIPBL-deficient cells. (A) Sμ and Sα recombination junctions from patient and control B cells were amplified via nested PCR and sequenced. Four sequences of recombination junctions from NIPBL-deficient patients are shown, representing different types of joining, including direct joining, 1-bp insertion, and microhomology (MH)-based joining. The Sμ and Sα reference sequences are aligned above and below the recombination junction sequences. MHs and imperfect repeats are indicated by boxes (solid and dotted lines, respectively). OL, overlap. The Sμ and Sα breakpoints for each switch fragment are indicated by black arrowheads, and their positions in the reference sequences are indicated above or below the arrowheads. (B) The accumulated percentages of switch junctions with given lengths of MH are plotted. (C) The age-matched control data (1–13 yr; 44 junctions) derived from the present study were merged with the previously published children control data (1–6 yr; 137 junctions; Du et al., 2008). The CSR junctions from the adult controls were described previously (Du et al., 2008). Significant differences (as compared with both children and adult control groups) are highlighted with bold letters and indicated by arrows (χ2 test, P < 0.05). (A–C) DNA from each patient was tested in 10 separate PCR reactions for each experiment, and the experiment was repeated at least once.

