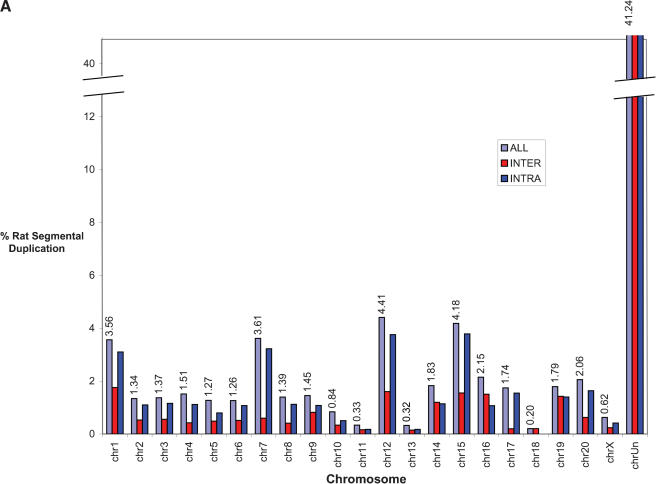
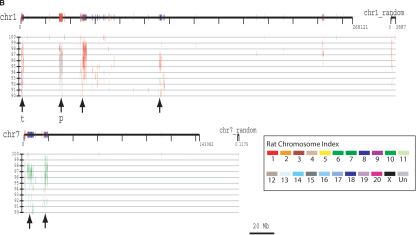
Figure 4.
(A) Segmental duplication content per chromosome. The relative proportion of intrachromosomal and interchromosomal duplications for each chromosome is shown. The above calculations treat the unmapped sequence as a separate chromosome when classifying duplications as inter- or intrachromosomal. Forty-five percent of the unplaced chromosome is made up almost entirely of duplicated sequence. (B) Duplication blocks. Rat segmental duplications clustered into larger regions ranging from 100 to 3000 kb in length. We termed these structures “duplication blocks.” Examples of duplication blocks on chromosomes 1 and 7 are presented (arrows) with the underlying degree of sequence identity for each pairwise depicted below the graph. Chromosome 1, green; chromosome 7, red. A subtelomeric (t) and pericentromeric (p) block are indicated. The regions of the rat genome are typified by low gene density (RefSeq/EST/mRNA), a high frequency of gaps within the assembly, and an excess of pairwise alignments.


