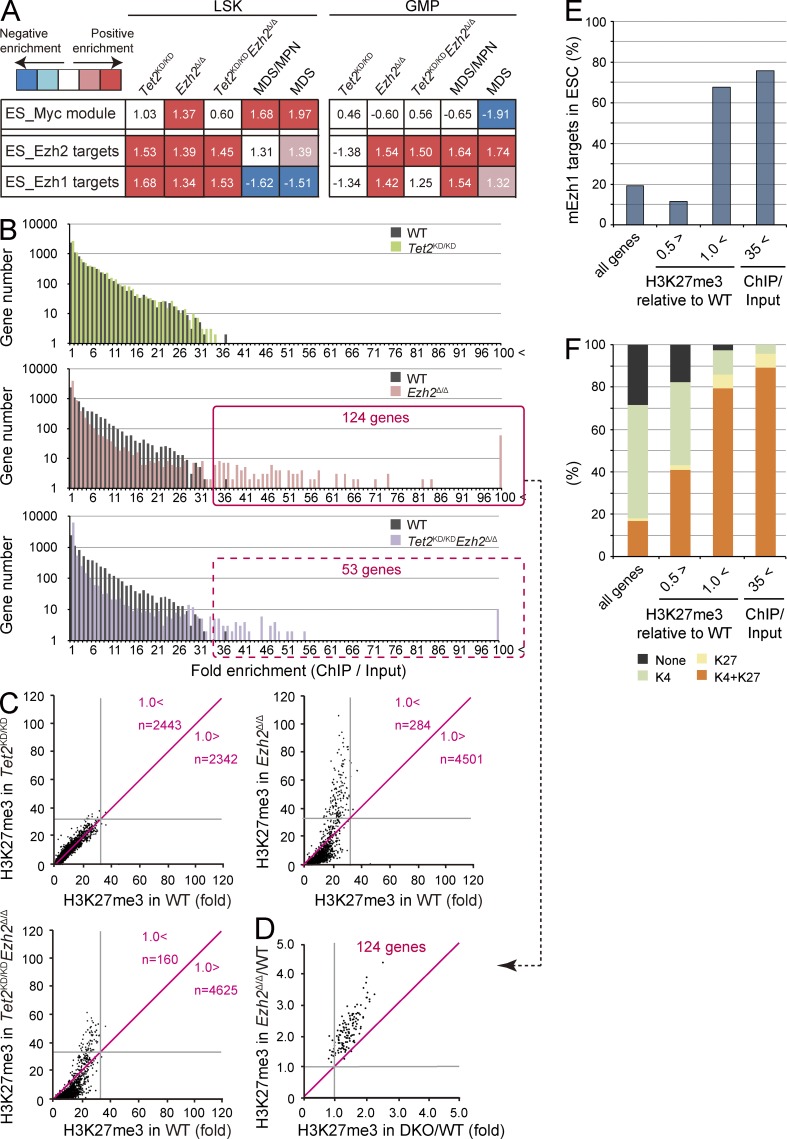
Figure 8.
Alterations in gene expression and H3K27me3 levels upon deletion of Ezh2. (A) Gene expression alterations associated with disease progression. Normalized enrichment score (NES) from overall gene expression profiles of LSK cells and GMPs derived from GSEA is shown as the number in each cell. Red and blue colors represent positive (up-regulated in the given genotype relative to WT) and negative (up-regulated in WT relative to the given genotype) enrichment, respectively. Concentrated colors show that the nominal p-value is <0.05 and false discovery rate (FDR) is <0.05, which suggests meaningful enrichment for the given gene sets. Pale colors show borderline enrichment. The cells which do not meet these criteria show white color. (B) Summary of H3K27me3 enrichment detected by ChIP-seq analysis. GMPs isolated from primary recipient mice at 4 mo after transplantation were subjected to ChIP-seq analysis using an anti-H3K27me3 antibody. The fold enrichment values of H3K27me3 signals were calculated against the input signals (ChIP/input) from 5.0 kb upstream to 0.5 kb downstream of the TSSs of RefSeq genes. The red boxes indicate genes with the H3K27me3 enrichment >35-fold in Ezh2Δ/Δ and Tet2KD/KDEzh2Δ/Δ GMPs. (C) Scatter plots of H3K27me3 enrichment in Tet2KD/KD, Ezh2Δ/Δ, and Tet2KD/KDEzh2Δ/Δ GMPs in comparison with that in WT GMPs. Gray lines indicate 35-fold enrichment, which is the value defined as high enrichment in A. The numbers of genes with higher and lower fold enrichment than that of WT (divided by red lines) are indicated. (D) Scatter plots of 124 genes enclosed by a red square in B showing the H3K27me3 enrichment >35-fold relative to WT in Ezh2Δ/Δ and Tet2KD/KDEzh2Δ/Δ (DKO) GMPs. Gray lines indicate 1.0, which is the value indicating that Ezh2Δ/Δ and Tet2KD/KDEzh2Δ/Δ GMPs showed the same fold enrichment as WT. (E and F) The proportion of Ezh1 target genes (E) and genes that are marked with univalent (H3K4me3 or H3K27me3) or bivalent histone domains (H3K4me3 and H3K27me3; F) identified in ES cells were categorized by the changes in H3K27me3 levels in Ezh2Δ/Δ GMPs. The proportions in all RefSeq genes are shown in the first lane. PRC2 target genes were subdivided into genes with reduced H3K27me3 levels (<0.5-fold compared with WT), genes that maintained H3K27me3 levels (>1-fold compared with WT), and genes with the H3K27me3 enrichment >35-fold compared with input in Ezh2Δ/Δ GMPs in B.

