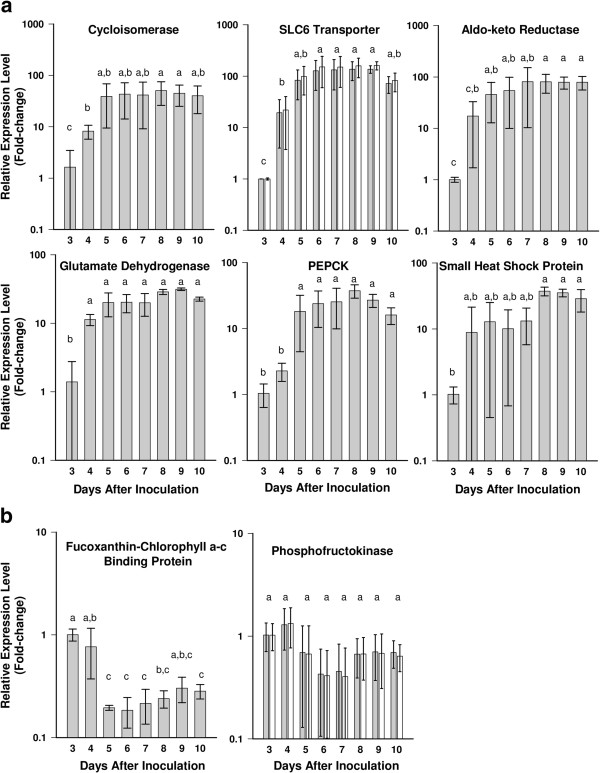
Figure 4.
RT-qPCR analysis of Pseudo-nitzschia multiseries genes whose expression was up-regulated (a) or down-regulated (b) in microarray analysis. Bars represent the mean change (± 1 SD) in expression relative to Day 3. Open bars represent measurements using primers that spanned an exon-exon junction; grey bars represent measurements using standard primers that did not span an exon-exon junction. Means with different letters were significantly different (p < 0.05). Statistical analyses were performed using a general linear model ANOVA with Bonferroni post-hoc test, 95% confidence intervals.

