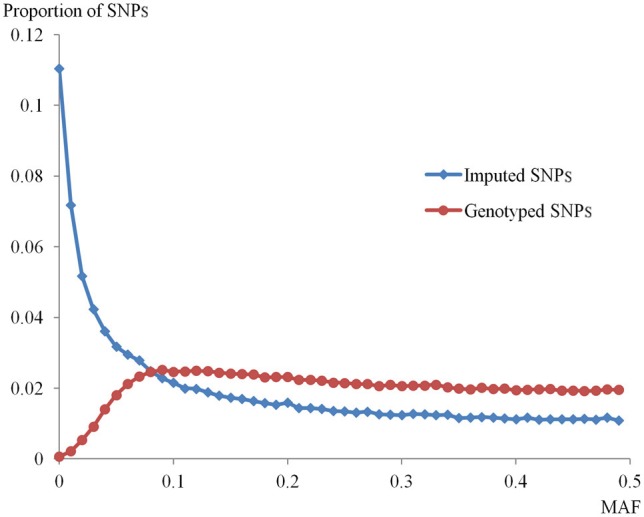
Figure 1.

Distribution of minor allele frequencies (MAFs) for genotyped and imputed SNPs. The distributions of MAF for imputed SNPs within the high_info group and for genotyped SNPs in this population are shown. The x-axis indicates the MAF of both groups of SNPs. The y-axis represents the proportion of SNPs in each MAF category.
