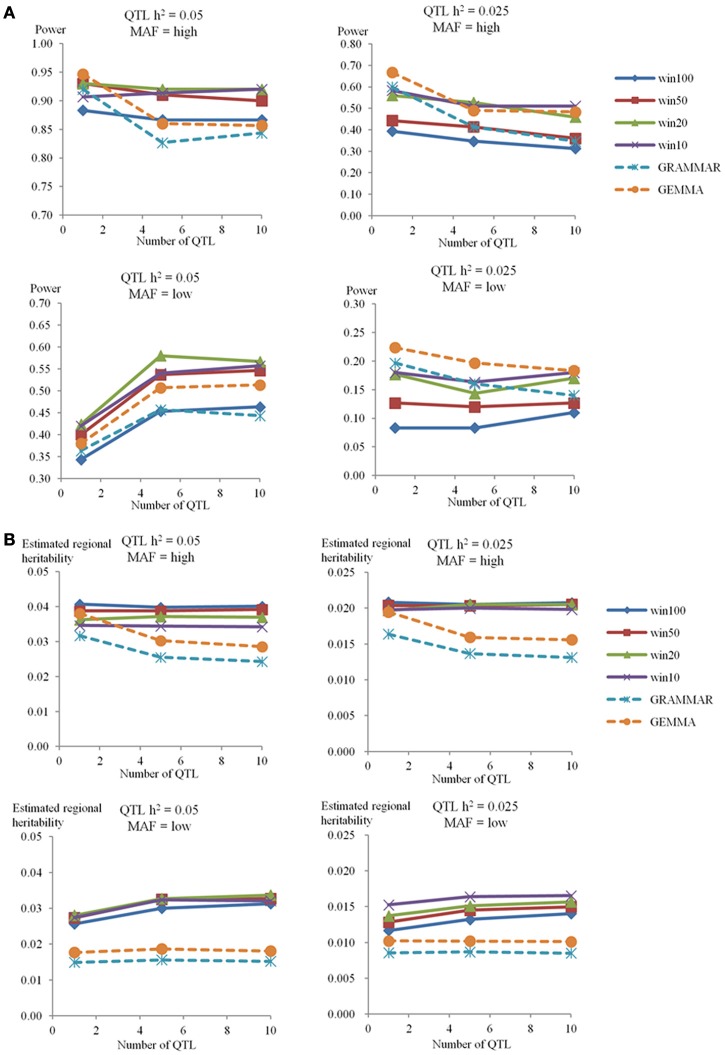
Figure 2.
The power to achieve 5% genome-wide significance and estimated regional heritability in the 100-SNP window. The powers (A) and estimated regional heritabilities (B) in the simulation study for genome heritability 0.4 were calculated by RHM with four different window sizes (100 SNPs as win100, 50 SNPs as win50, 20 SNPs as win20, and 10 SNPs as win10), and two single-SNP GWAS methods (GRAMMAR and GEMMA) in the different situations. The number of QTL is on the x-axis, and the power to detect QTL (A) or the estimated regional heritability (B) are on the y-axis. Each graph shows the different situations for genome heritability 0.4 (QTL heritability is 0.05 or 0.025, and MAF is high or low).

