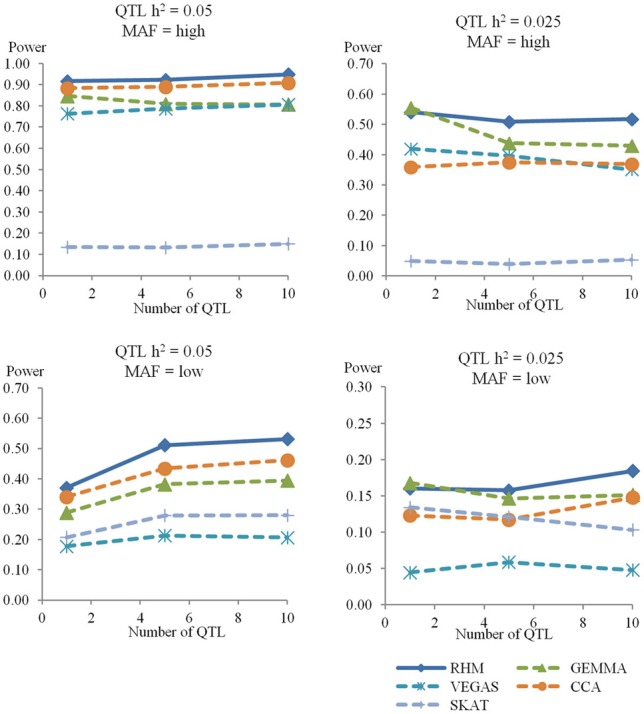
Figure 3.

The power to achieve 5% genome-wide significance in the gene region. The powers in the simulation study for genome heritability 0.4 were calculated by RHM with window size 10 (RHM), single-SNP GWAS (GEMMA), and three gene-based association approaches (VEGAS, CCA, and SKAT) in the different situations. The number of QTL is on the x-axis, and the power to detect QTL is on the y-axis. Each graph shows the different situations for genome heritability 0.4 (QTL heritability is 0.05 or 0.025, and MAF is high or low).
