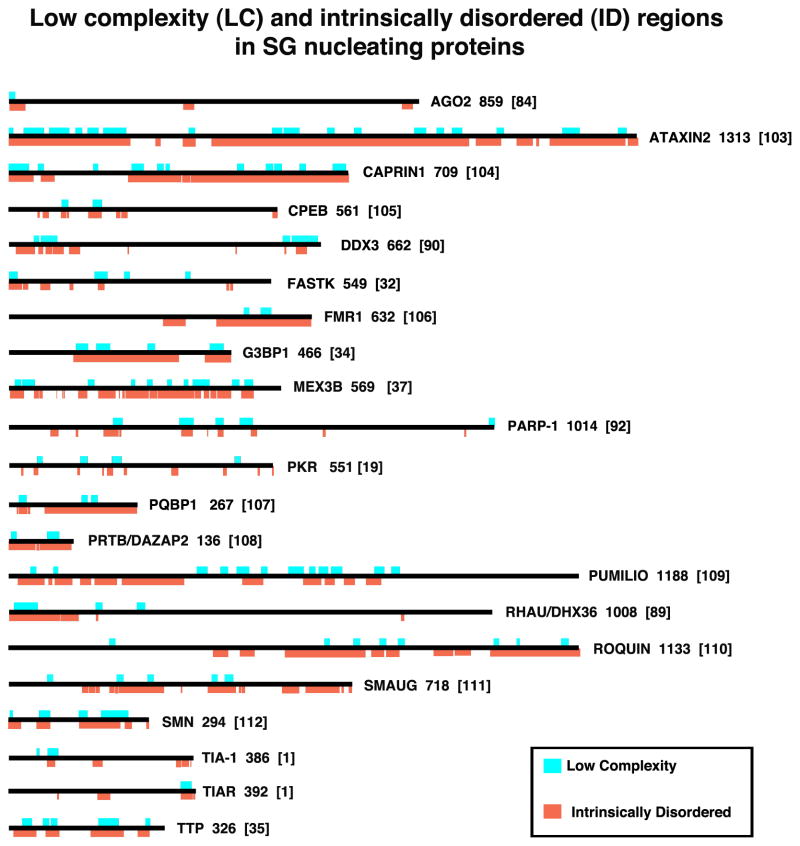
Figure 3. Low complexity (LC) and intrinsically disordered (ID) regions in SG nucleating proteins.
SG nucleating proteins are shown to scale and their LC (aqua) and ID (orange) regions are indicated. The numbers to the right of each schematic indicates the number of amino acids in the isoform shown (usually the largest one); numbers in brackets indicate the reference. LC (aqua) regions were obtained from the NCBI “conserved domains” graphic, which calculates low complexity regions using the SEG program 28. Intrinsically Disordered regions were determined using the programs 29 on the ANCHOR website (http://anchor.enzim.hu/), in which regions of disorder exceeding 50% on the Intrinsically Unordered histograms were graphically rendered (orange). Note that all SG-nucleating proteins contain at least some LC/ID regions, and that some SG-nucleating signaling proteins (OGFOD1, DYRK3) are shown in Fig. 4 rather than here.

