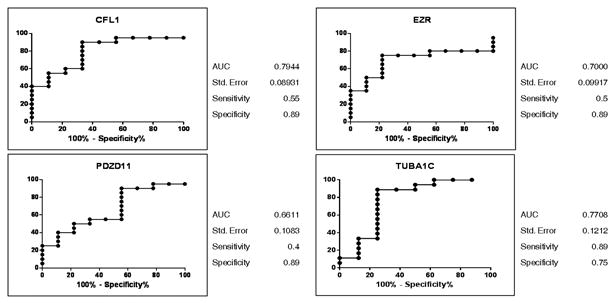
Figure 4. Receiver operating characteristic (ROC) curves discriminating ovarian cancer from benign controls.

The ROC curves for selected autoantibody markers for ovarian cancer were generated using GraphPad Prism 5. Area under the ROC curve (AUC) with 95% confidence intervals (CI) was calculated and a P-value of ≤ 0.05 was considered to be statistically significant.
