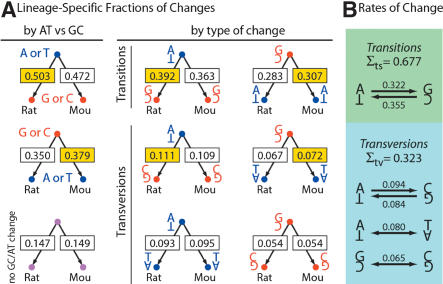
Figure 2.
Fractions and rates of nucleotide substitution events observed within the mouse and rat lineages. (A) Fractions of various nucleotide changes within each lineage. Larger fractions are colored yellow if the change alters base composition. (Left panel) Sums of changes that result in the same change in base composition (A or T to G or C, e.g., which includes both transitions and transversion events). (Right panel) A more detailed classification of these data by the exact type of change (two transitions, four transversions), with base pairs shown to unambiguously describe the type of change. (B) Relative rates of each transition and transversion, corrected for base composition and averaged between the two rodents (see Methods). Counts of the given substitution events were divided by the frequency of the departing nucleotide, and subsequently normalized such that the values for all changes from the two lineages sum to 1. Note that either transition is approximately fourfold more likely than any given transversion.

