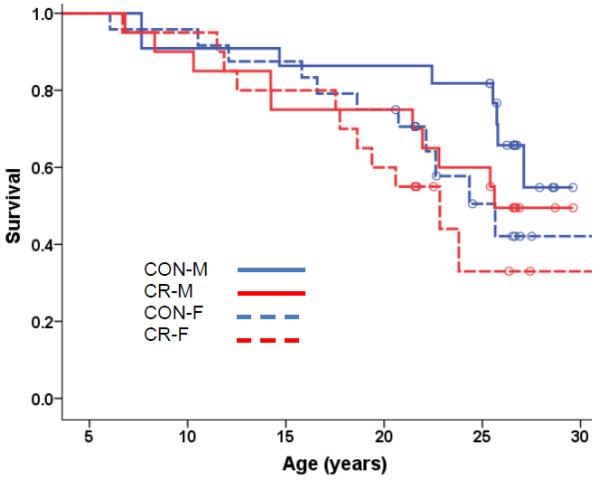
Fig 3A.

Kaplan-Meier Survival Curves for All-Cause Mortality for Young-Onset Monkeys. All-cause mortality in the young-onset monkeys was analyzed using Cox regression with age of onset, origin, sex, and diet (p = 0.255) as predictors with none of these factors being statistically significant. Therefore Kaplan-Meier survival curves for the two diet groups were plotted to display the results. Open circles represent monkeys that are still alive.
