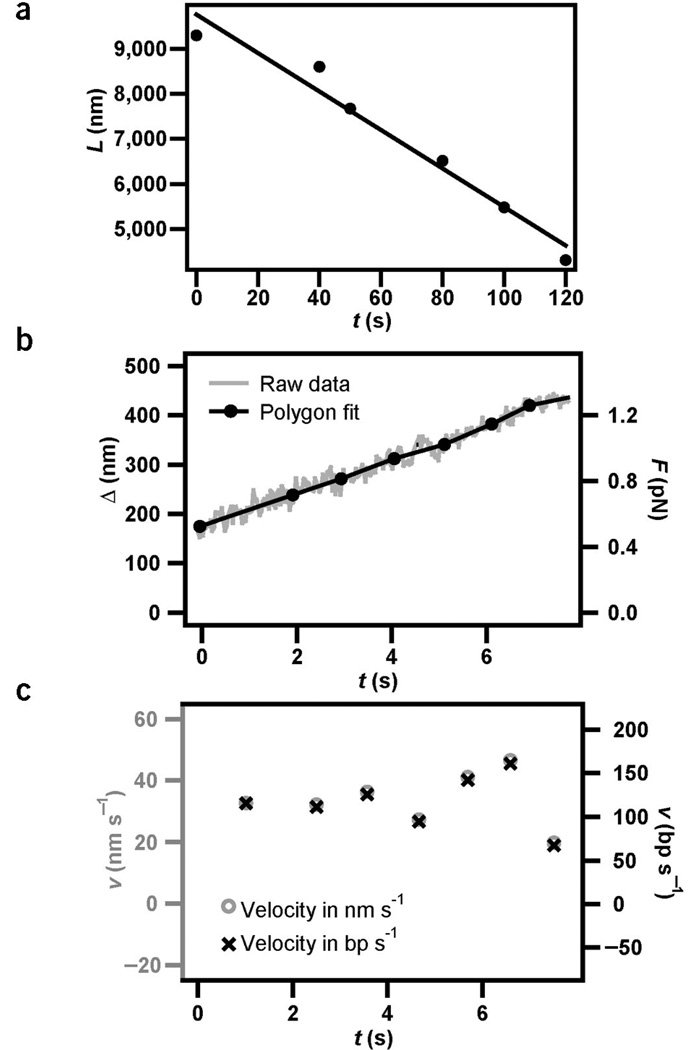
Figure 4.
Kinetics of DNA uptake. The stiffness of the optical trap was ktrap = 0.004 pN nm−1. (a) The distance between the bead and the bacterium, L, decreased as a function of time during DNA uptake. The full line is the best linear fit, yielding an average uptake rate of vshort = 43 ± 5 nm s−1. (b) Example for tether shortening, Δ, as a function of time during DNA uptake and best polygon fit with an average time interval of 1 s. (c) Uptake velocity derived from b. The average uptake rate of the bacterium in a was vshort = 34 ± 4 nm s−1 (n = 6). Taking into account the elastic properties of DNA, positional information was converted into uptake velocity measured in base pairs per second (Supplementary Fig. 2 online).

