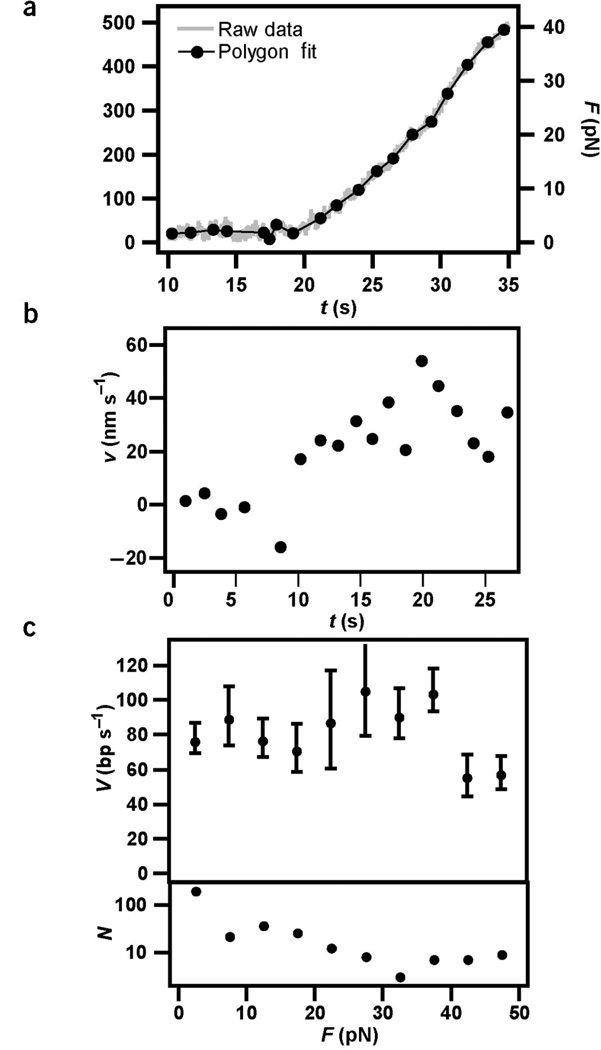
Figure 5.
Force generation during DNA transport. ktrap = 0.16 pN nm−1. (a) Example of tether shortening as a function of time. The full line is the best polygon fit with an average time interval of 1.3 s. DNA uptake started at t = 10 s. The force was calculated from the deflection of the bead from the center of the laser trap. Owing to continuous bacterial movement in this force range, the latter was <Δ (Supplementary Fig. 1 online). (b) Uptake velocity derived from a. (c) Top graph, velocity of DNA transport averaged over 31 retraction curves and a force interval of 5 pN. Bottom graph, number of samples per force interval.

