Figure 1.

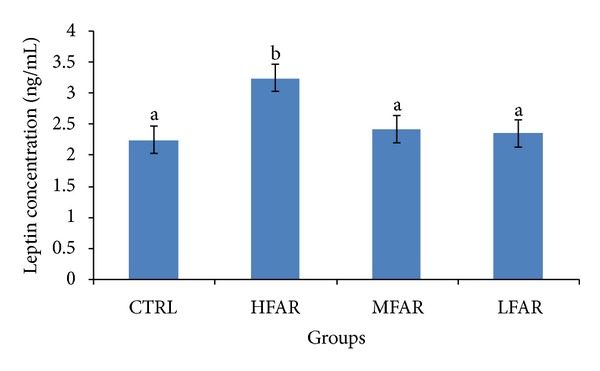
Plasma leptin concentration of rats in the four treatment groups. a, bDifferent letters among groups indicate significant difference at P < 0.05.

Plasma leptin concentration of rats in the four treatment groups. a, bDifferent letters among groups indicate significant difference at P < 0.05.