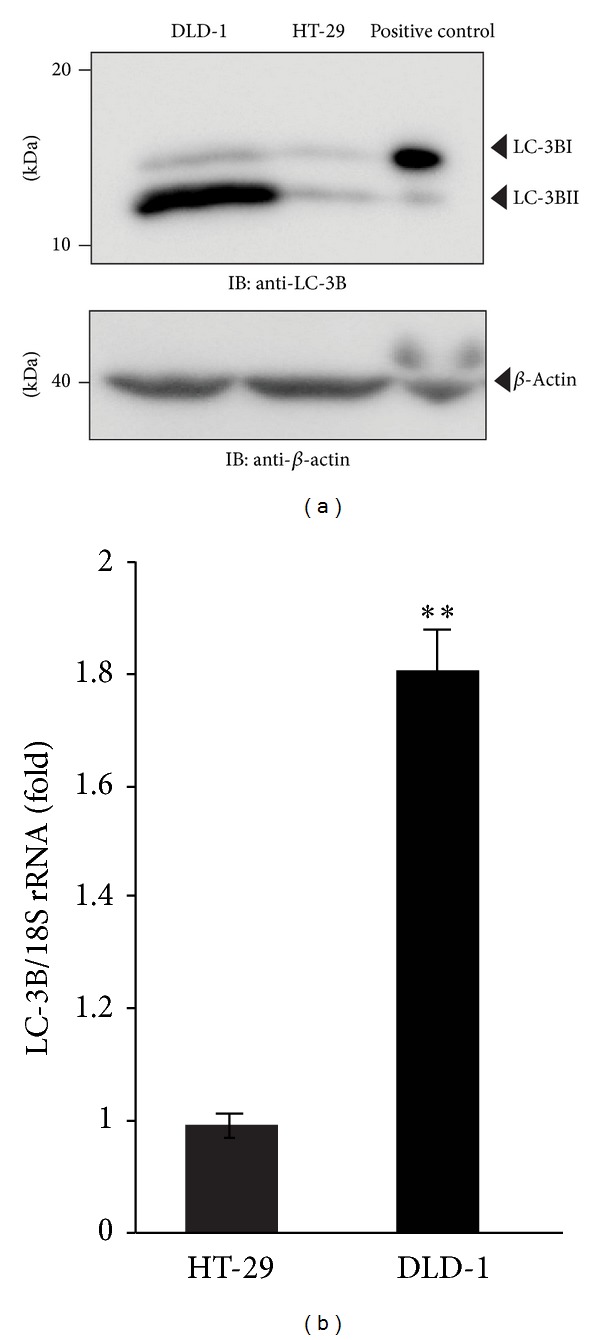
Figure 1.

Comparison of endogenous LC3B protein expression. (a) Representative western blot of LC3-I and LC3-II expression. Whole cell lysate (50 μg) was analyzed by SDS-PAGE and visualized with enhanced chemiluminescence as described in the experimental procedures. (b) Real-time PCR measurement of LC3B mRNA expression in DLD-1 and HT-29 cells. The relative LC3B levels normalized to 18S rRNA are expressed as the mean ± SEM (n = 3), **P < 0.01.
