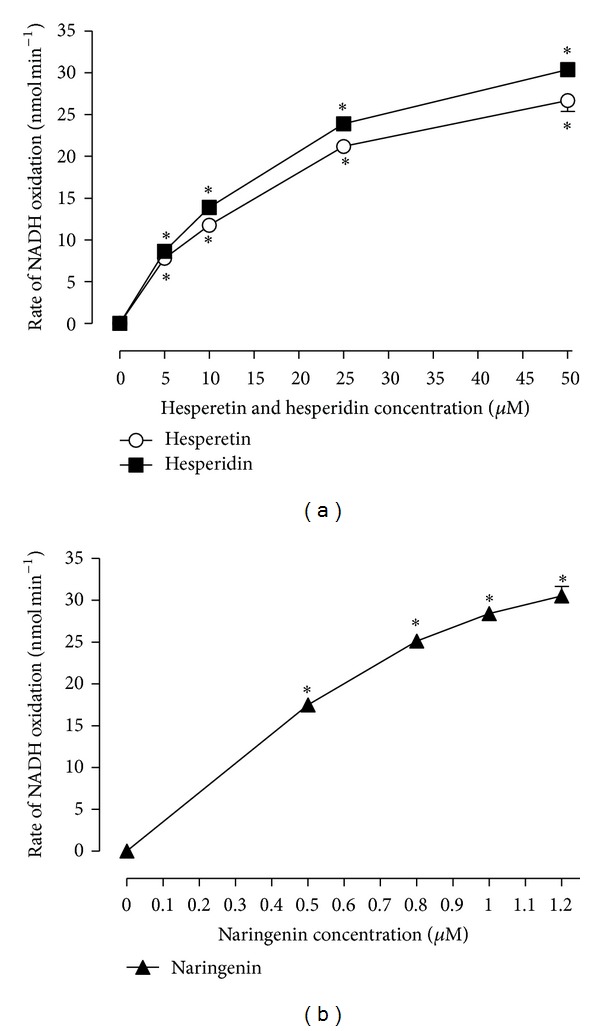
Figure 6.

(a) and (b) show the dependence of the rate of peroxidase-catalysed NADH oxidation on the concentrations of the flavanones hesperidin, hesperetin, and naringenin. Values represent the means ± standard errors of three separate experiments. Asterisks indicate a statistically significant difference compared to the control condition, as revealed by variance analysis with post hoc Newman-Keuls testing (*P < 0.05).
