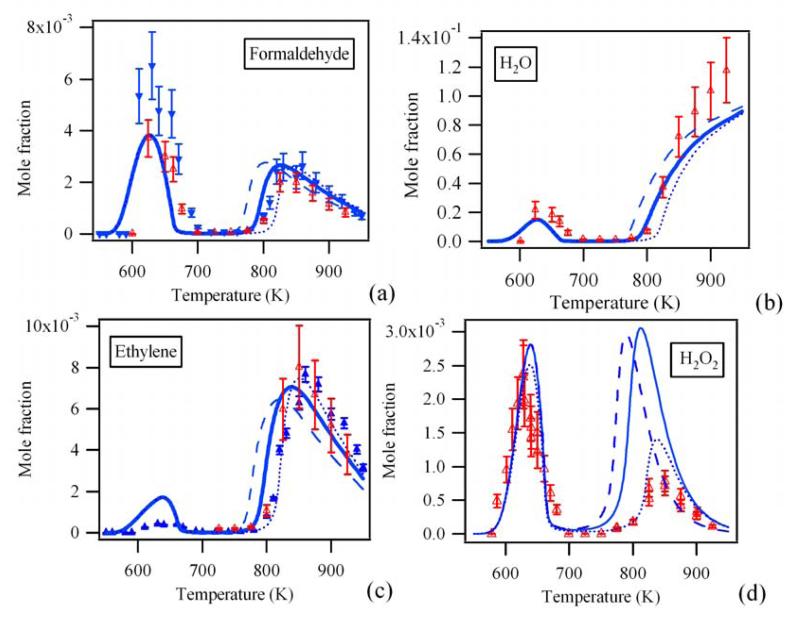
Figure 1.
Profile of CH2O (a), H2O (b), C2H4 (c) and H2O2 (d). Full blue symbols: GC measurements. Open red symbols: experimentally obtained concentration by averaging the mole fractions obtained from different CRDS absorption lines. Dashed lines: gas phase model such from Battin-Leclerc et al.8. Full lines: gas phase model with the revised rate constant for H2O2 decomposition. Dotted lines: gas phase model as full line, but with additional H2O2 wall destruction.

