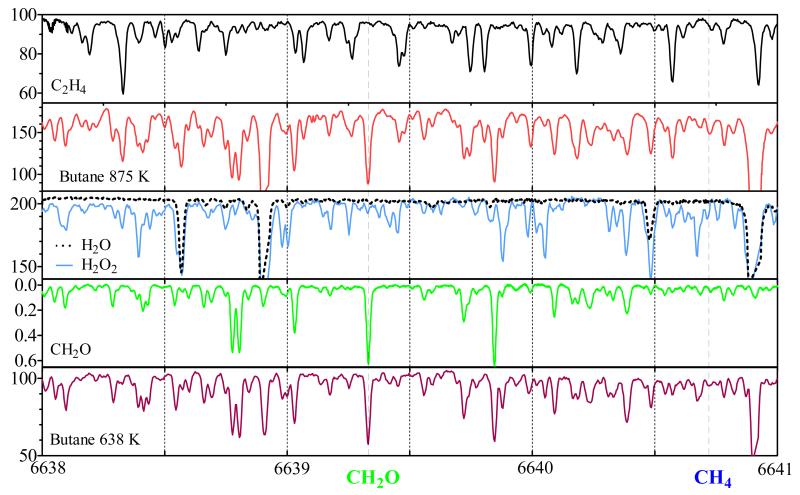
Figure 3.
Absorption spectrum in the range 6638 – 6641 cm−1 for the major absorbing reaction products (ring down time as a function of wavenumber for H2O2, H2O and C2H4, absorption cross sections in 20−21 cm2 taken from Staak et al for CH2O) as well as the spectrum such as observed from the oxidation of n-butane at 638 K and 875 K. CH4 line at 6640.72 cm−1 al blue dotted line, CH2O line at 6639.33 cm−1 as green dotted line.

