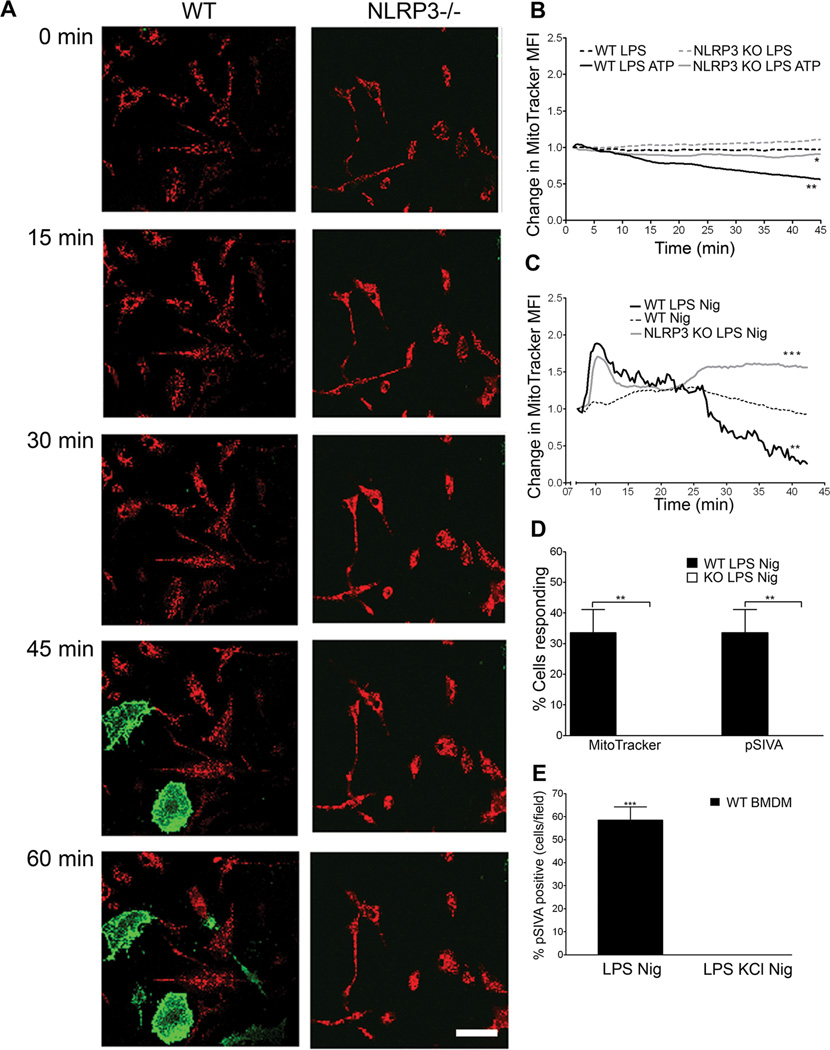
Figure 3. Loss of mitochondrial membrane permeability and cell death are NLRP3 dependent.
(A) WT and NLRP3 −/− BMDM were LPS primed and treated with 20 µM nigericin. Cells were stained with MitoTracker red (red) and pSIVA (green), imaged for one hour with a confocal live cell microscope. Images from one representative experiment shown. Scale bar= 50 µm (B) Loss of MitoTracker red signal over time was recorded via live cell microscopy. Cells were left untreated or treated with 3mM ATP. Data was normalized to initial signal with background subtraction. (n≥9, at 45 min *, P=0.0382 for WT LPS ATP vs KO LPS ATP; **, P=0.0021 for WT LPS vs WT LPS ATP). (C) Cells were imaged as in (B) with 20 µM nigericin (n=6; at 40 min. ***, P= 0.0001; **, P=0.0015) (D) Percentage of cells/field that lost MitoTracker signal or gained pSIVA signal over 1 hour of confocal live cell imaging. Error bars represent ± s.d. (MitoTracker n=4; **, P=0.002; pSIVA, n=3; **, P=0.002) (E) Cells were treated with or without 50 mM KCl and imaged for one hour on a confocal live cell microscope. Percent of cells/field that were pSIVA positive at 60 min recorded. Error bars represent ± s.d. (n=3; ***, P=0.0001).

