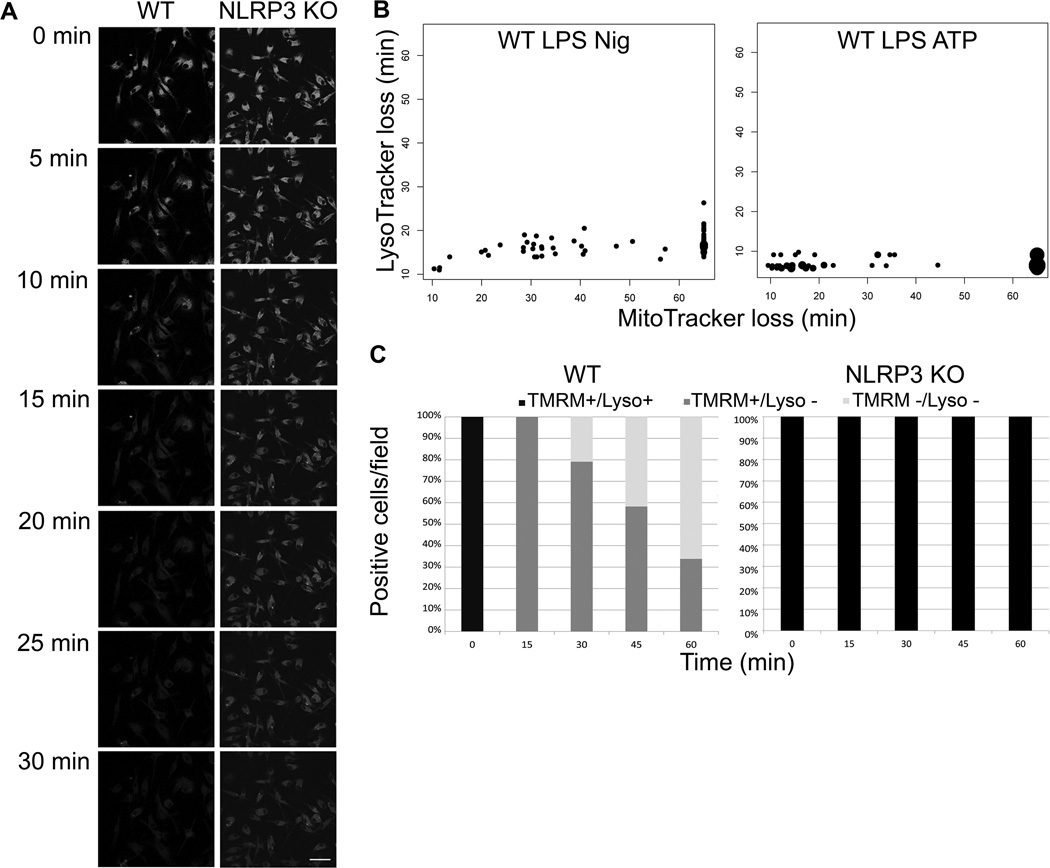
Figure 4. Loss of lysosomal membrane permeability is NLRP3 dependent.
(A) WT and NLRP3−/− BMDM were LPS primed, stained with LysoTracker Green and imaged via live cell confocal microscope with 20 µM nigericin treatment for 30 min. Data from one representative experiment shown. Scale bar= 50 µm (B) WT BMDM were LPS primed, treated with 20 µM nigericin or 3 mM ATP, and stained with MitoTracker Red and LysoTracker Green. Cells were imaged for one hour after nigericin or ATP addition via live cell microscopy. Data were recorded as time to loss of signal, each dot represents one cell with larger dots representing multiple cells. Cells that did not lose MitoTracker Red were recorded as data points beyond 60 min imaging period. Data from five fields are displayed. (C) WT BMDM or NLRP3 KO BMDM were LPS primed and nigericin treated, stained with TMRM and LysoTracker Green, and imaged with live cell microscopy for 1 hr. Percent of cells/field staining positive for each of the two dyes was recorded. n≥5 fields.

