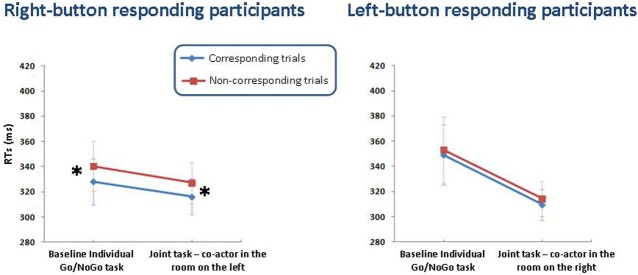
Figure 4.

Means (± S.E.M.s) of correct RTs for right- and left-button responding participants in Experiment 3. RTs are plotted as a function of task (baseline vs. joint task) and spatial correspondence (corresponding vs. non-corresponding trials), separately for the two response button positions (right- vs. left-button participants). Asterisks indicate the presence of the Simon effect.
