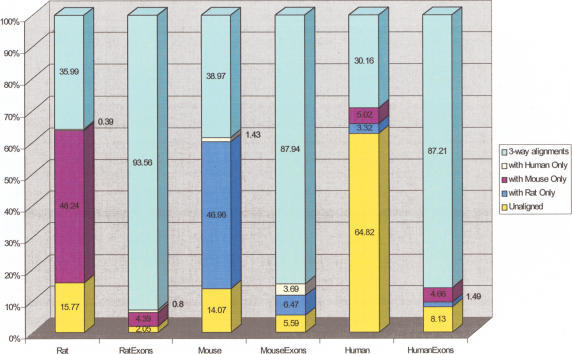
Figure 3.
The chart shows the coverage of the three genomes and the RefSeq coding exons on the three genomes in our alignments using the thresholds from the Mouse genome comparisons (Waterston et al. 2002; Schwartz et al. 2003). The chart makes clear that although the bulk of the rat and mouse genomes can be confidently aligned to the other rodent, only a minority (35%-40%) is alignable to human. The percentage of each rodent genome that is aligned to human but not to the other rodent (0.4% of rat, 1.4% of mouse) is reflective of the fraction of the sequence missing in the other rodent.

