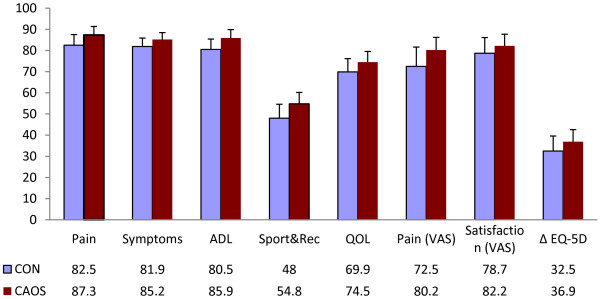
Figure 5.

Questionnaire outcomes. Mean outcome scores for CON and CAOS. The first 5 outcomes represent the KOOS subscales. Results are adjusted for age, sex, fixation, Charnley category and preoperative EQ-5D index score (except for ΔEQ-5D). Outcomes were measured on a scale from 0 (worst) to 100 (best).
