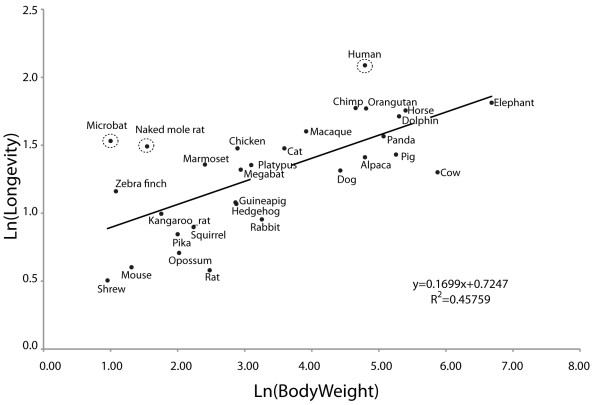
Figure 1.
Plot of the maximum longevity versus body weight for a collection of amniotes. The natural log (lnL) of body weight is plotted against the lnL of longevity for the species analysed in this study. The regression line indicates a correlation between both life history traits. The exceptions are microbat (M. lucifugus), human and naked mole rat circled to highlight their extreme values.

