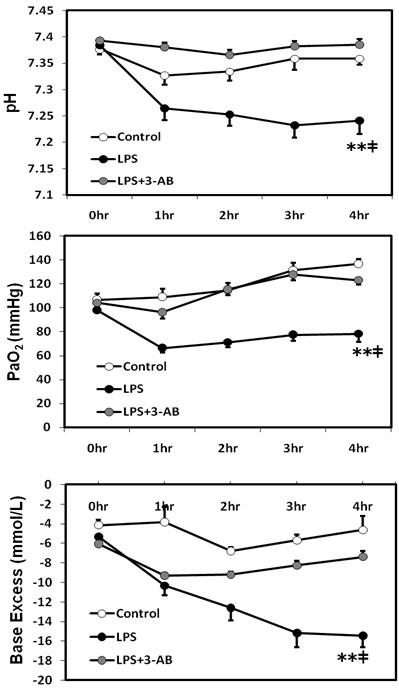
Figure 2.

Changes in arterial blood gas variables. Values are expressed as mean ± SE. **p < 0.01 vs. the LPS + 3-AB group, ‡p < 0.01 vs. the control group.

Changes in arterial blood gas variables. Values are expressed as mean ± SE. **p < 0.01 vs. the LPS + 3-AB group, ‡p < 0.01 vs. the control group.