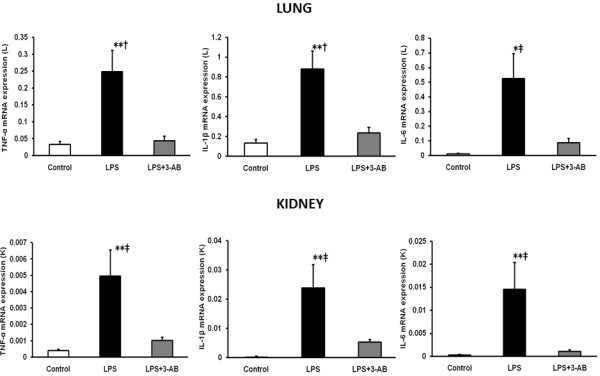
Figure 3.

Comparison of mRNA expression of cytokines in lung and kidney relative to GAPDH. Total RNA was extracted from lung (L) and kidney (K) following 4 h after exposure to LPS and quantified relative to GAPDH by TaqMan real-time PCR. Each column with a bar represents the mean ± SE. *p < 0.05, **p < 0.01 vs. the LPS + 3-AB group, †p < 0.05, ‡p < 0.01 vs. the control group.
