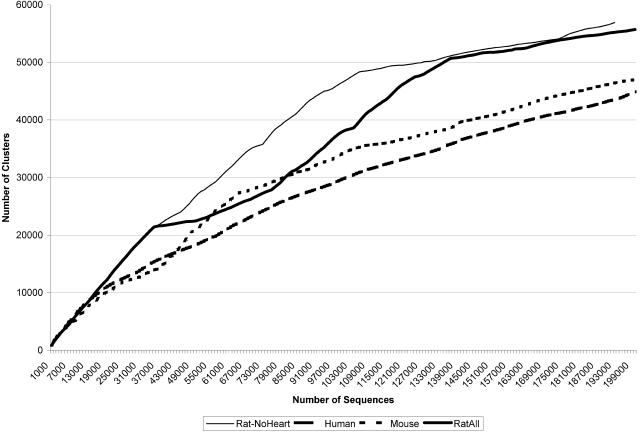
Figure 3.
Gene discovery in rat, mouse, and human. Discovery per 1000 sequences is presented to compare the rates of EST-based gene discovery among human, mouse and rat. The rat discovery rate is presented with and without the rat heart libraries to demonstrate the power of focused gene discovery with normalization and serial subtraction of cDNA libraries.

