Figure 2.
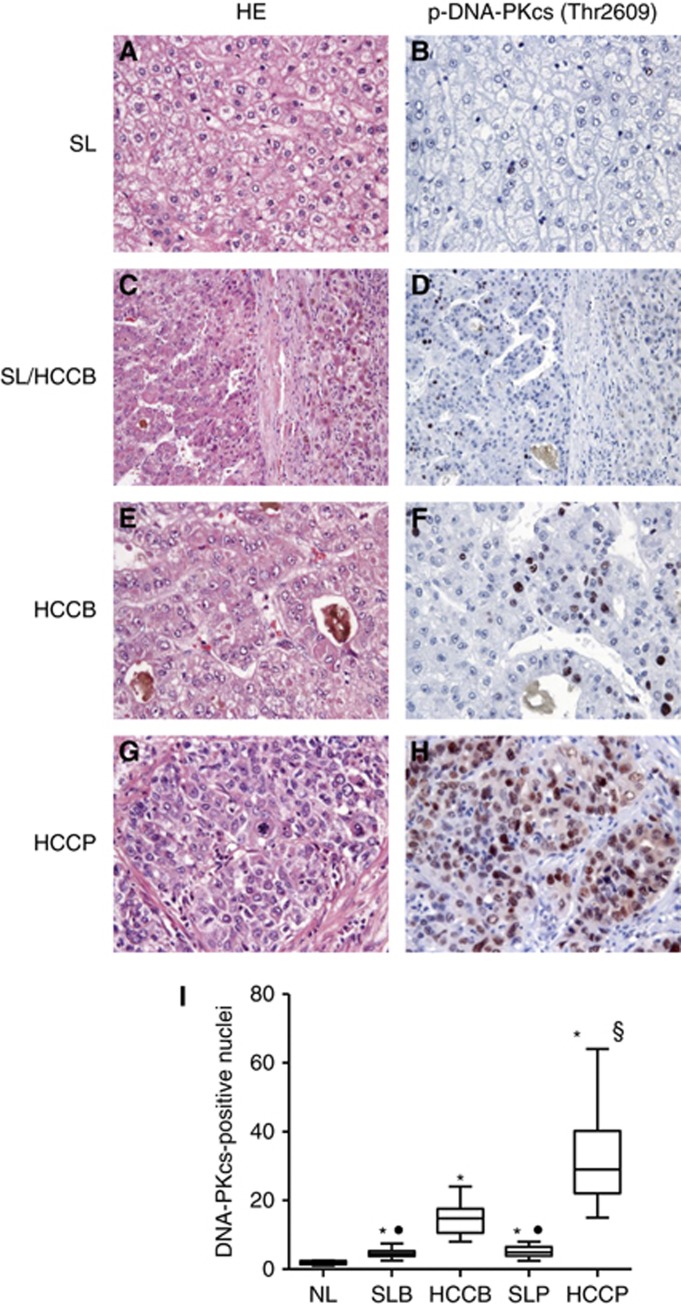
(A–H): Liver histology (stained with hematoxylin and eosin; HE) and representative immunohistochemistry of activated/phosphorylated (Thr2609) DNA-PKcs in HCC subtypes with better (HCCB; E, F) or poorer (HCCP; G, H) outcome, and respective non-tumourous surrounding livers (SL; A, B). Note the progressive increase of DNA-PKcs from SL to HCCP (C, D). The HE shows a typical macrotrabecular HCC in the left part of the picture and a rim of surrounding non-neoplastic liver tissue at the right (G, H). Poorly differentiated HCCP showing a strong p-DNA-PKcs immunoreactivity in most of the malignant hepatocytes. Original magnification × 200 in C and D; × 400 in A, B, E–H. (I): Box plots showing the dispersion of the results of six normal livers (NL), 22 HCCB, 22 HCCP and corresponding SLs evaluated for p-DNA-PKcs nuclear immunoreactivity. Mann–Whitney test: *Indicates difference from NL: at least P=0.0004 for all lesions. •Indicates difference from HCC: P<0.0001 for HCCB and HCCP. §Indicates difference from HCCB: P<0.0001.

