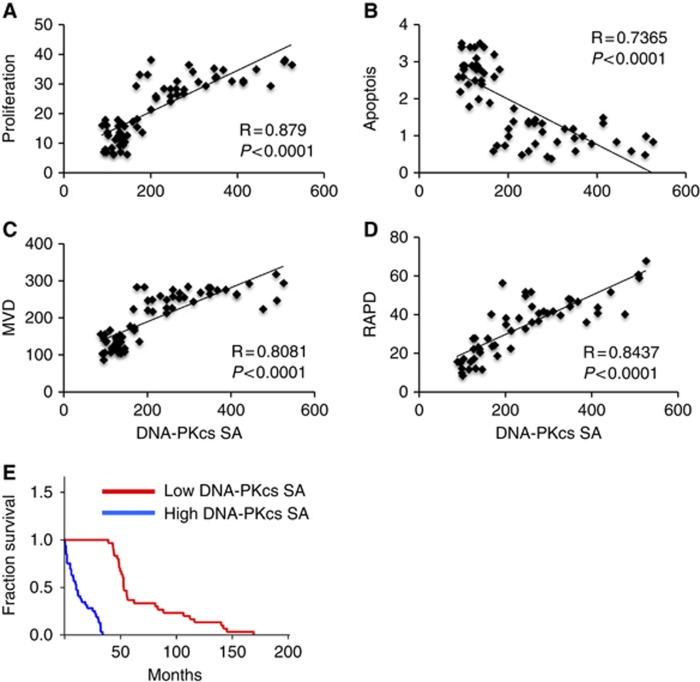
Figure 3.
Relationship between DNA-PKcs-specific activity and biological features of human HCC. The relationships of DNA-PKcs specific activity (SA; as assessed by ELISA) and proliferation index (expressed as the percentage of Ki67-positive nuclei with respect to total cells counted) (A); apoptotic index (percentage of apoptotic cells) (B); microvessel density (MVD; percentage of CD34-positive cells) (C) and genomic instability (RAPD; expressed as the percentage of primers showing altered RAPD profiles) (D); is shown. (E) Kaplan–Meier survival curves of human HCC with high and low DNA-PKcs SA. Two-phase decay curves were used to calculate the cutoff value of DNA-PKcs (204–230) in correspondence to curve intersection in the correlation analysis of DNA-PKcs with proliferation, apoptosis, MVD and RAPD. Mantel–Cox statistical analysis: differences between survival curves, P<0.0001.

