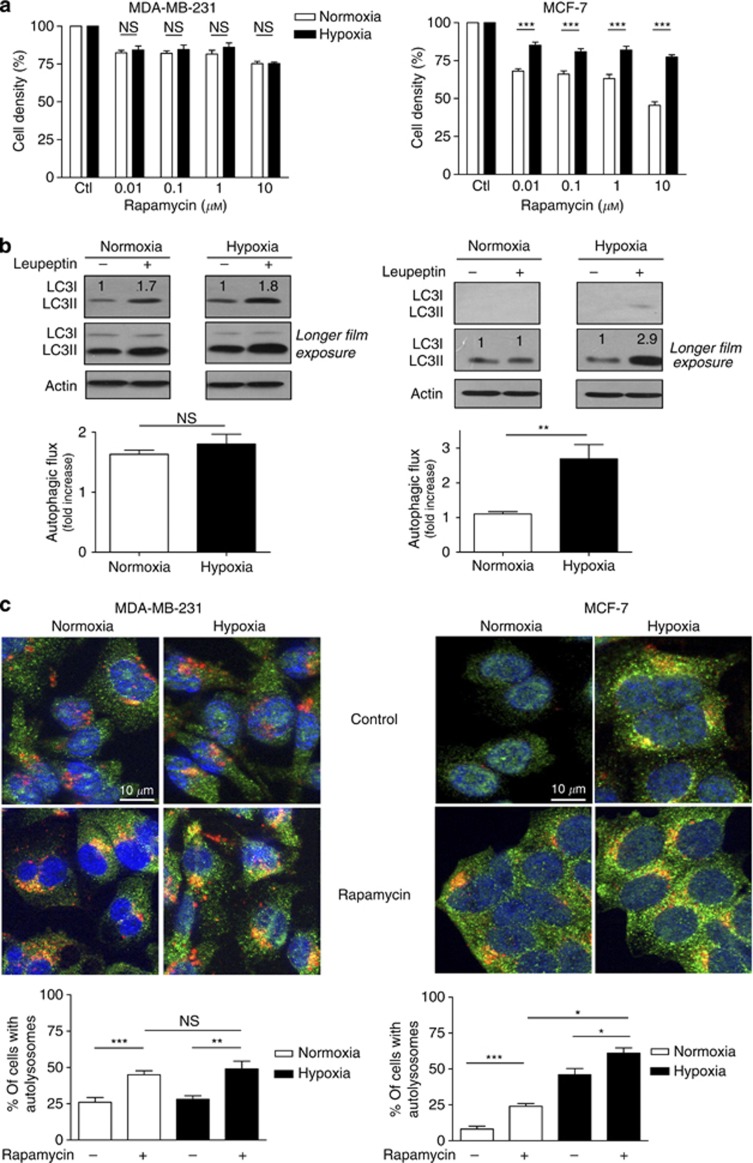
Figure 3.
Hypoxia promotes rapamycin resistance and autophagy in MCF-7 but not in MDA-MB-231 cells. (A) Bar graphs represent the amounts of viable MDA-MB-231 and MCF-7 cells (expressed as % of control) after 72 h treatment with the indicated doses of rapamycin under normoxia or hypoxia (***P<0.001, n=3–4). (B) Representative LC3I and LC3II immunoblotting experiments are presented for MDA-MB-231 and MCF-7 cells exposed for 48 h to normoxia or hypoxia with or without 500 μM leupeptin; a longer film exposure is provided to better show LC3II accumulation. Bar graphs represent the autophagic flux determined as the fold-induction LC3-II accumulation in the presence of leupeptin (**P<0.01, n=3). (C) Representative immunofluorescence detection of LC3 (green staining) and LAMP-1 (red staining) in MDA-MB-231 and MCF-7 cells after 48 h treatment with 100 nM rapamycin under normoxia or hypoxia; yellow–orange staining indicates the presence of autolysosomes. Bar graphs represent the proportion of cells (%) exhibiting autolysosomes (yellow punctate staining reflecting LC3/LAMP-1 colocalisation) (*P<0.05, **P< 0.01, ***P<0.001, NS, not significantly different, n=3).

