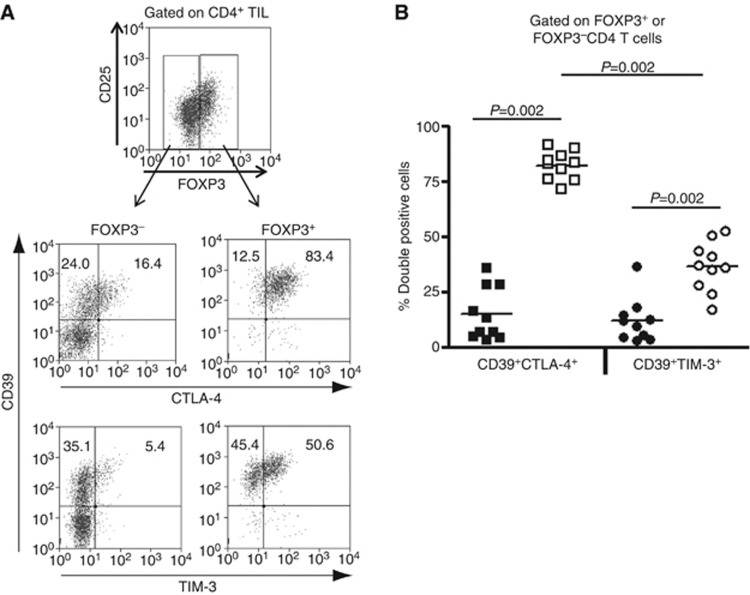
Figure 3.
CTLA-4 and CD39 are co-expressed on the majority of intratumoral FOXP3+ Treg. (A) CTLA-4, TIM-3 and CD39 expression on intratumoral FOXP3+ Treg was analysed by flow cytometry. FOXP3+ and FOXP3− cells were, respectively, evaluated for their frequency of CTLA-4+, CD39+ and TIM-3+ cells. The numbers represent fraction of CTLA-4+, TIM-3+ and CD39+ cells in FOXP3+ or FOXP3− CD4+ T cells. (B) Percentages of double-positive CD39+CTLA-4+ or CD39+TIM-3+ cells in FOXP3+CD4+ T cells (open squares and circles) are compared with those in FOXP3−CD4+ T cells (filled squares and circles, n=9). Then, the percentage of double-positive CD39+CTLA-4+ cells was compared with that of CD39+TIM-3+ cells in FOXP3+ Treg.

