
Figure 3.
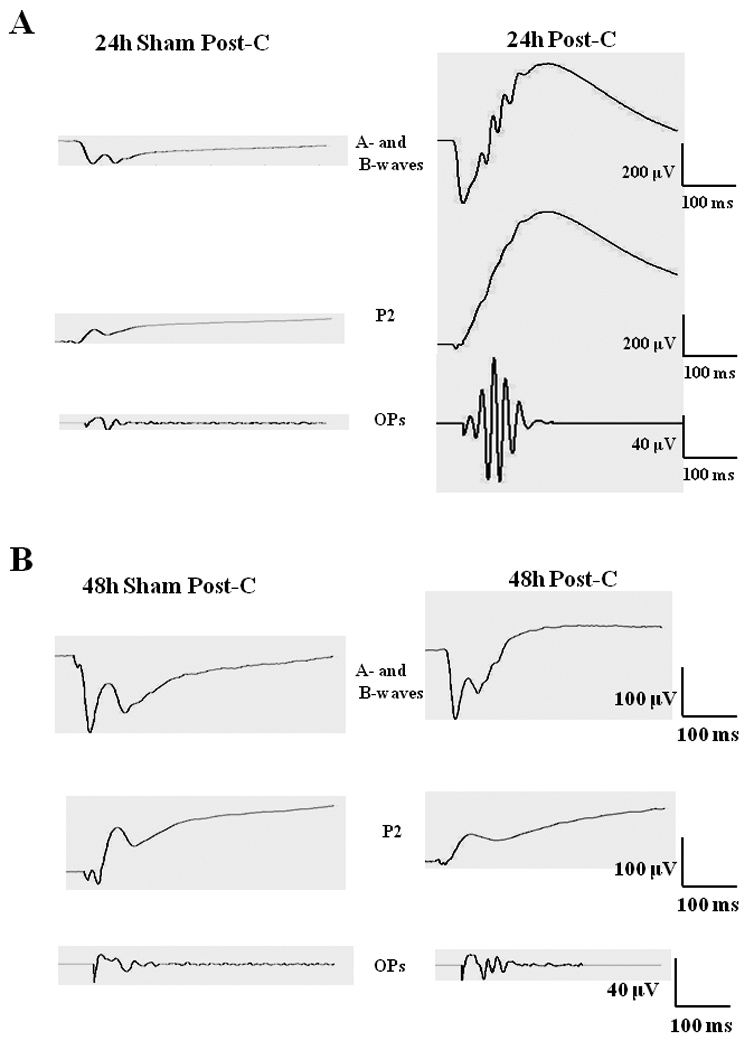
(A) Representative ERG traces at 0.87 log cd.s/m2 flash intensity for the a- and b-wave (top), P2 (middle) and the OPs (bottom) for both 24 h post-C and 24 h sham post-C groups. (B) Representative ERG traces at 0.87 log cd.s/m2 flash intensity for the a- and b-wave (top), P2 (middle) and the OPs (bottom) for both 48 h post-C and 48 h sham post-C groups.