
Figure 5.
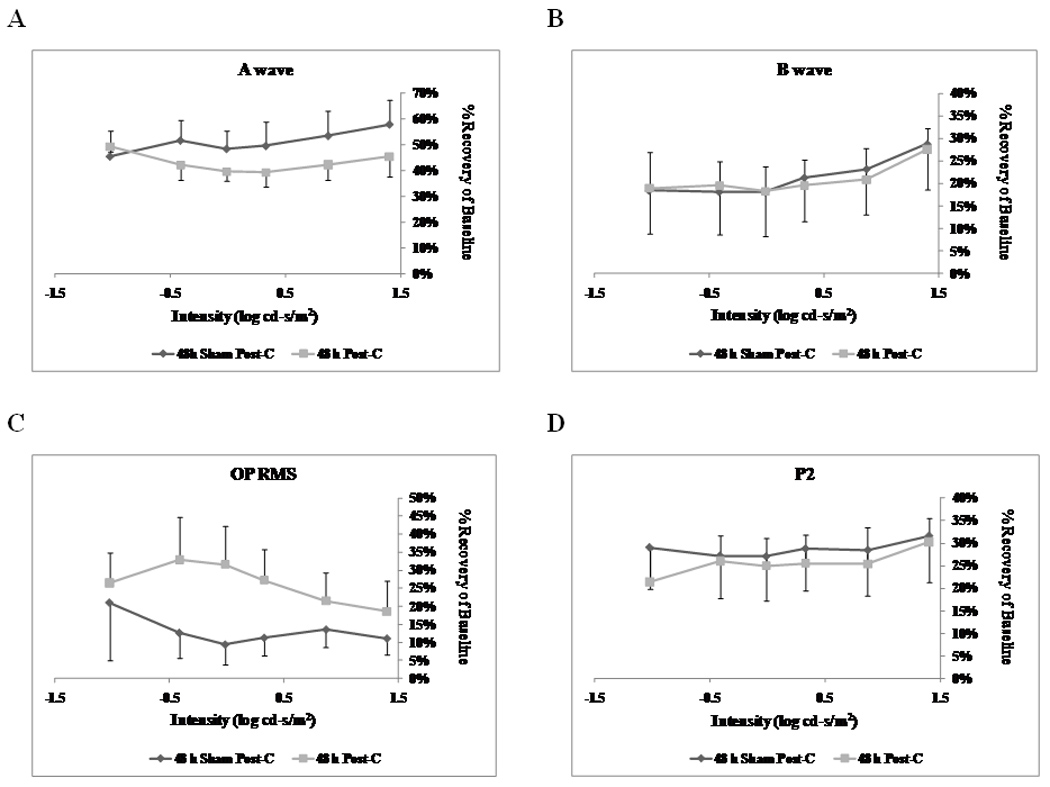
Stimulus-Intensity response in post-conditioned retinae for 48 h post-C vs 48 h sham post-C. Double normalized (corrected for the non-ischemic eye and for diurnal variation from baseline to 7 days after post-C) ERG data for a-, b-wave, oscillatory potentials (sum of root mean square, OP RMS) and P2 over a range of flash intensities from −1.02 to 1.40 log cd-s/m2. The data were recorded at baseline (prior to ischemia) and at 7 days after post-conditioning; post-C was applied 48 h after ischemia. ERG data for a- (A), b-wave (B), OP RMS(C) and P2 (D) over a range of flash intensities suggests that 48 h delayed post-C was not functionally protective. Solid lines with diamonds = 48 h sham post-C (n = 4). Solid lines with squares = 48 h post-C (n = 4).