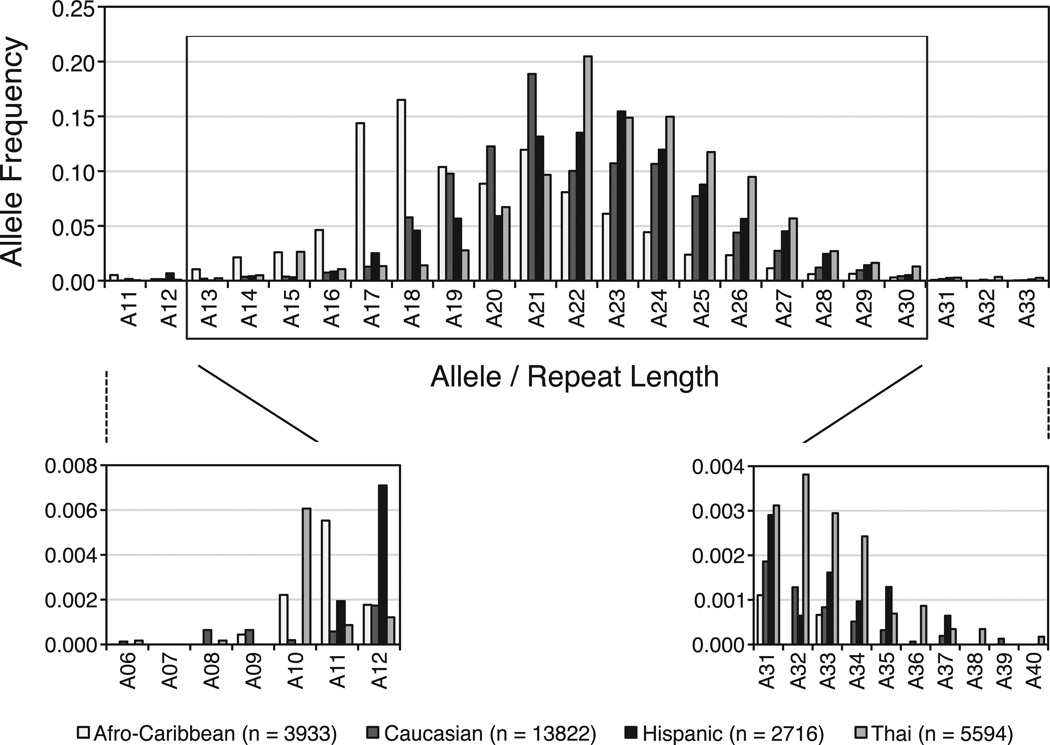
Figure.
Distribution of AR (CAG)n alleles by ethnic group in the Hyperglycemia and Adverse Pregnancy Outcome study. Top panel: only alleles with a frequency >.001 are shown. The alleles within the inner box are the alleles used for the χ2 analysis for all ethnicities. Lower left panel: individuals in each ethnicity with the lowest number of CAG repeats. Lower right panel: individuals in each ethnicity with the highest number of CAG repeats. White bars indicate Afro-Caribbean participants; dark gray, Caucasians; black, Hispanics; light gray, Thais. n = number of chromosomes.

