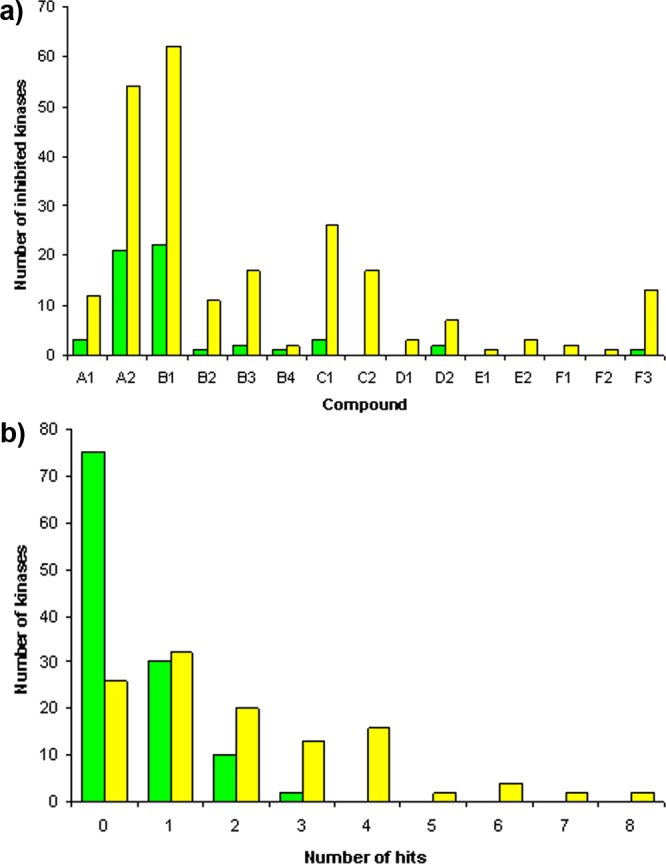
Figure 5.

(a) Bar chart showing the number of kinases inhibited to at least 40% (yellow bars) or 75% (green bars) based on 15 compounds tested against a panel of 117 kinases. (b) Bar chart showing how many kinases were inhibited by how many compounds to at least 40% (yellow bars) or 75% (green bars) based on 15 compounds tested against a panel of 117 kinases.
