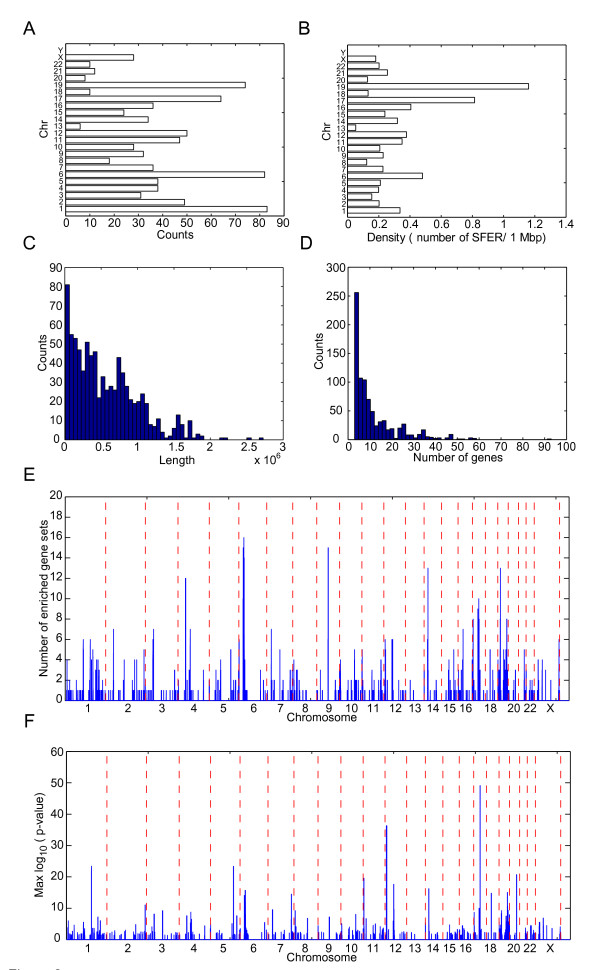
Figure 2.
The summary of the spatial functional hotspots. (A) The histogram of the length of the SFHs. (B) The histogram of the gene numbers in the SFHs. (C) The SFH number in each chromosome. (D) The SFH density (numbers of SFHs per million base pair) in each chromosome. (E) The most significant p value and (F) the number of SFHs in the position of human genome. In (E) and (F), the chromosomes were separated by red broken lines.

